Using ChatGPT to analyze data in STATA
In a previous article, I demonstrated how you can use the AI chatbot from OpenAI – ChatGPT – as your “co-pilot” when analyzing data in SPSS. At DATAFORDEV we are also very proud of our STATA courses so this discussion about how AI can be used in statistical data analysis cannot be complete if we don’t talk about STATA.
Watch the video below to see just how you can accomplish that.
If you would like to practice and follow along, download the dataset used in the video here.
Here are the steps I took:
Provide context
I started by giving ChatGPT the context of what I wanted to do. In the case of data analysis support, you can do this by pasting your whole dataset (from my tests, ChatGPT is able to read not more than 250 rows of data at the moment). You can also simply explain or paste in your codebook which is the definition of the variables you have in your dataset. I did the latter.
Here was my prompt:
The following is a codebook for a dataset on the nutrition of under 5 children. Read and understand as I will need your help analyzing the data using STATA version 13

Variable name	Label	Values
ID	Case ID	Numbers from 1 to 413
hmi	Household monthly income	US Dollars
phe	Parents Highest Education	1=No education, 2= Primary, 3=Secondary, 4=Tertiary
cbw	Child birth weight	Number of Kgs
s	Child Sex	1=Male, 2=Female
cam	Child age	Number of months
ChatGPT responded by assuring me that it has read and understood the context:

Although it followed through with asking for me to paste the dataset, knowing ChatGPT’s limitations in memorizing context and reading very long prompts, I went ahead to ask for insights on how I can analyze the data.
NOTE: In this demonstration, I was using the GPT-3.5 model. If you paid for ChatGPT and you have access to GPT-4, I will highly recommend that you use it instead since it excels highly in creative thought and has a large context window.
- Ask for insights to analyze the data
If you are not sure of the kind of analysis you can do on the data, all you must do is ask for insights. I asked:
What insights can I extract from the dataset?
The response I got was mind-blowing. ChatGPT was able to suggest almost everything you would want to extract from the dataset:
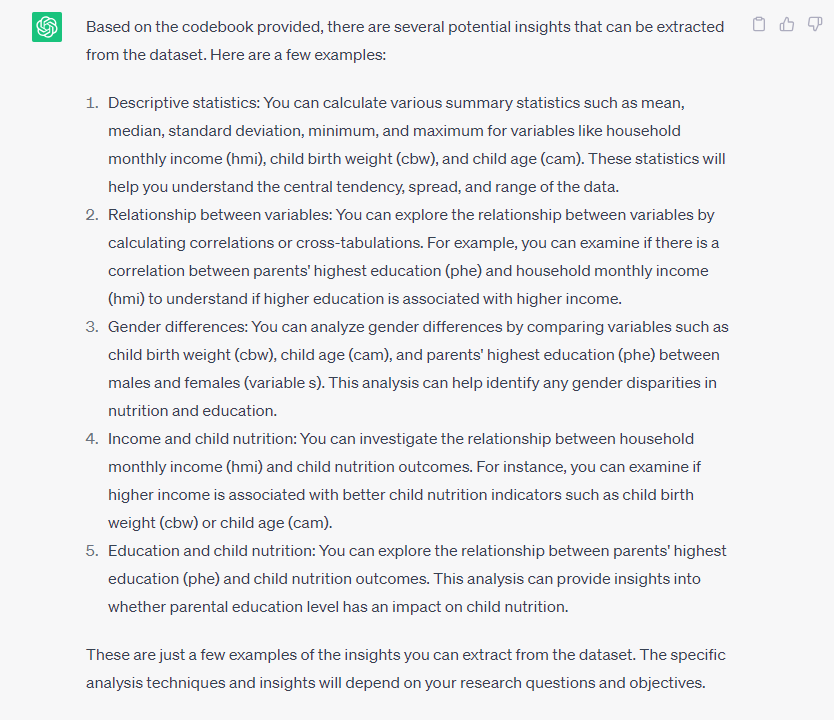
From this point, all I needed to do was ask for directions on how I can run those analyses in STATA.
Get the commands you can use to analyze the data in STATA
Armed with the insights I can extract from my dataset; the next step was to ask for the kind of commands I can use in STATA. Here was my next prompt:
What STATA command should I use to run the descriptive statistics in point 1
In this case, I was referring to the descriptive statistics ChatGPT had suggested in its previous response.
In its response, I was given 3 separate STATA summarize commands for summarizing the continuous variables in the dataset.
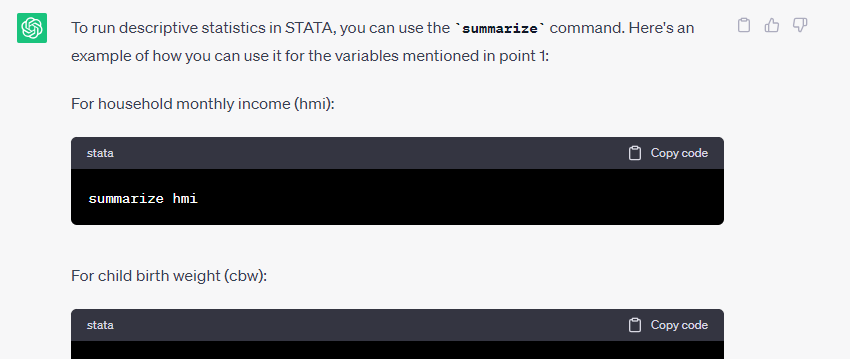
I tried running the commands it gave me and they all ran without error.
Next, I wanted to explore the gender differences ChatGPT suggested I could analyze from the dataset. Here was my prompt:
What STATA commands should I use to explore the gender differences for child birth weight, including a chart
Here is part of the response that I got:
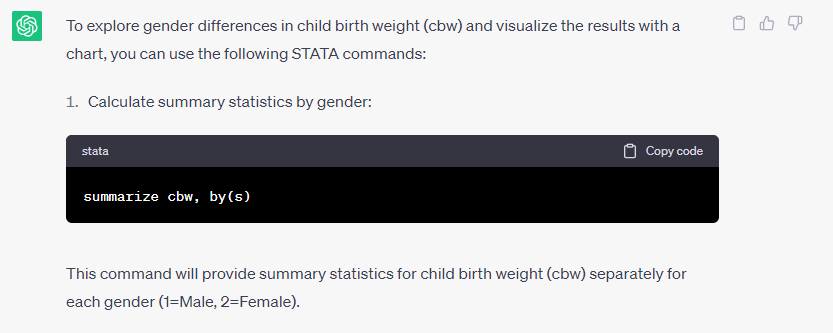
Unfortunately, running the command in STATA returned an error. So, I had to go back to ChatGPT with the error I got. Here was my next prompt:
I got an error:

. summarize cbw, by(s)
option by() not allowed
r(198);
ChatGPT responded by acknowledging that it had erred in its command suggestion – the summarize command does not have a built-in by() option.
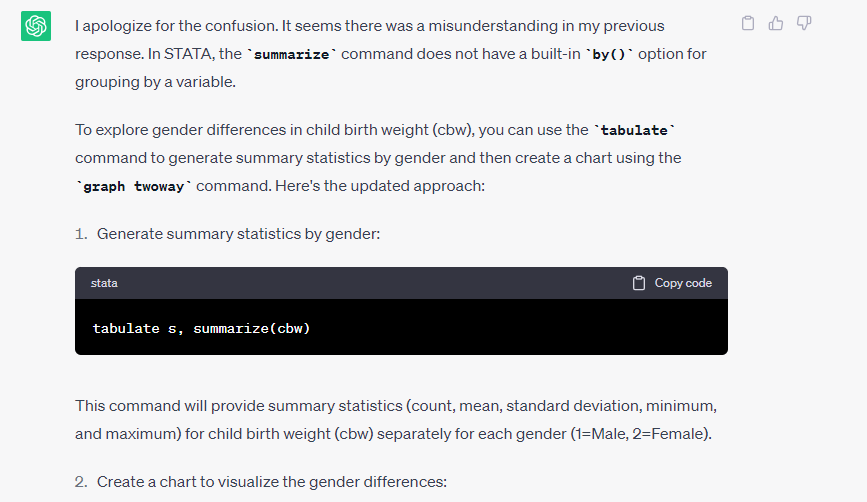
I tried the new suggestion it gave me which worked like a charm in STATA.
I also tried the charts that were suggested, and although they weren’t really the charts I would use in the situation, the commands run without issue.
This is why even with the help of ChatGPT, you still need to know your way around statistical data analysis. I suggest enrolling in the STATA course on DATAFORDEV course platform where you will not only learn the commands, but also the statistical fundamentals behind the analyses.
In my case, I would use a bar/column chart with the categories on the x axis and average child birth weight on the y axis. If I needed help with the command for this, all I had to do was ask ChatGPT to tell me
Get help with interpretation and reporting
Finally, with the output I got from STATA, I sought ChatGPT’s help in interpreting and coming up with the write-up. I started by pasting the output from STATA, and then asked for the interpretation and reporting. Here was my prompt:
Sex of |    Summary of Child Birth Weight
      child |        Mean   Std. Dev.       Freq.
------------+------------------------------------
     Female |   2.6080303   .34159919         198
       Male |   2.9938605   .34173072         215
------------+------------------------------------
      Total |   2.8088862   .39204185

Write the interpretation and report in APA format
As expected, ChatGPT went ahead and provided the interpretation and write-up for my results as follows:
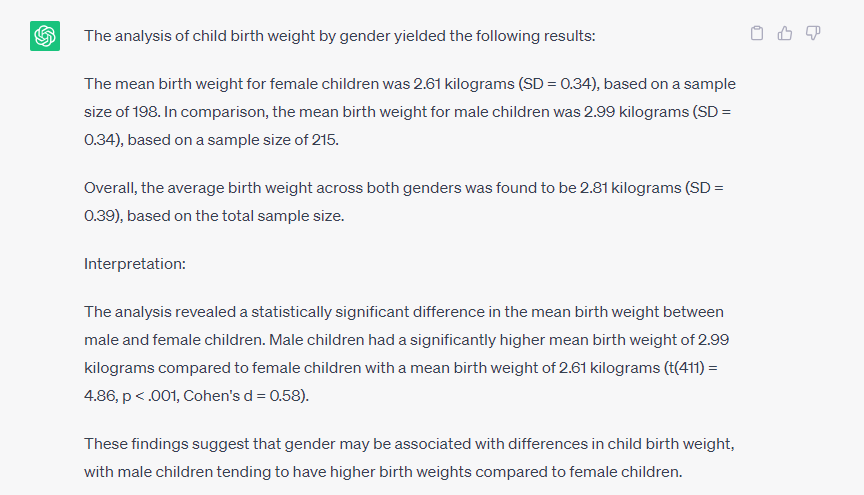
What was interesting is that in the reporting, it included t statistics which were not part of the output I had provided. I would highly recommend that you go ahead and double-check by running the t-test in STATA before simply copying and pasting the text from ChatGPT into your report.
You can view the full conversation here:
Conclusion
The use of artificial intelligence tools like ChatGPT represents a big opportunity for students doing research, researchers and data analysts. Although not perfect in some situations, we are now able to learn faster, draw insights from data much easier and get the help we need in our data analysis and reporting processes.
