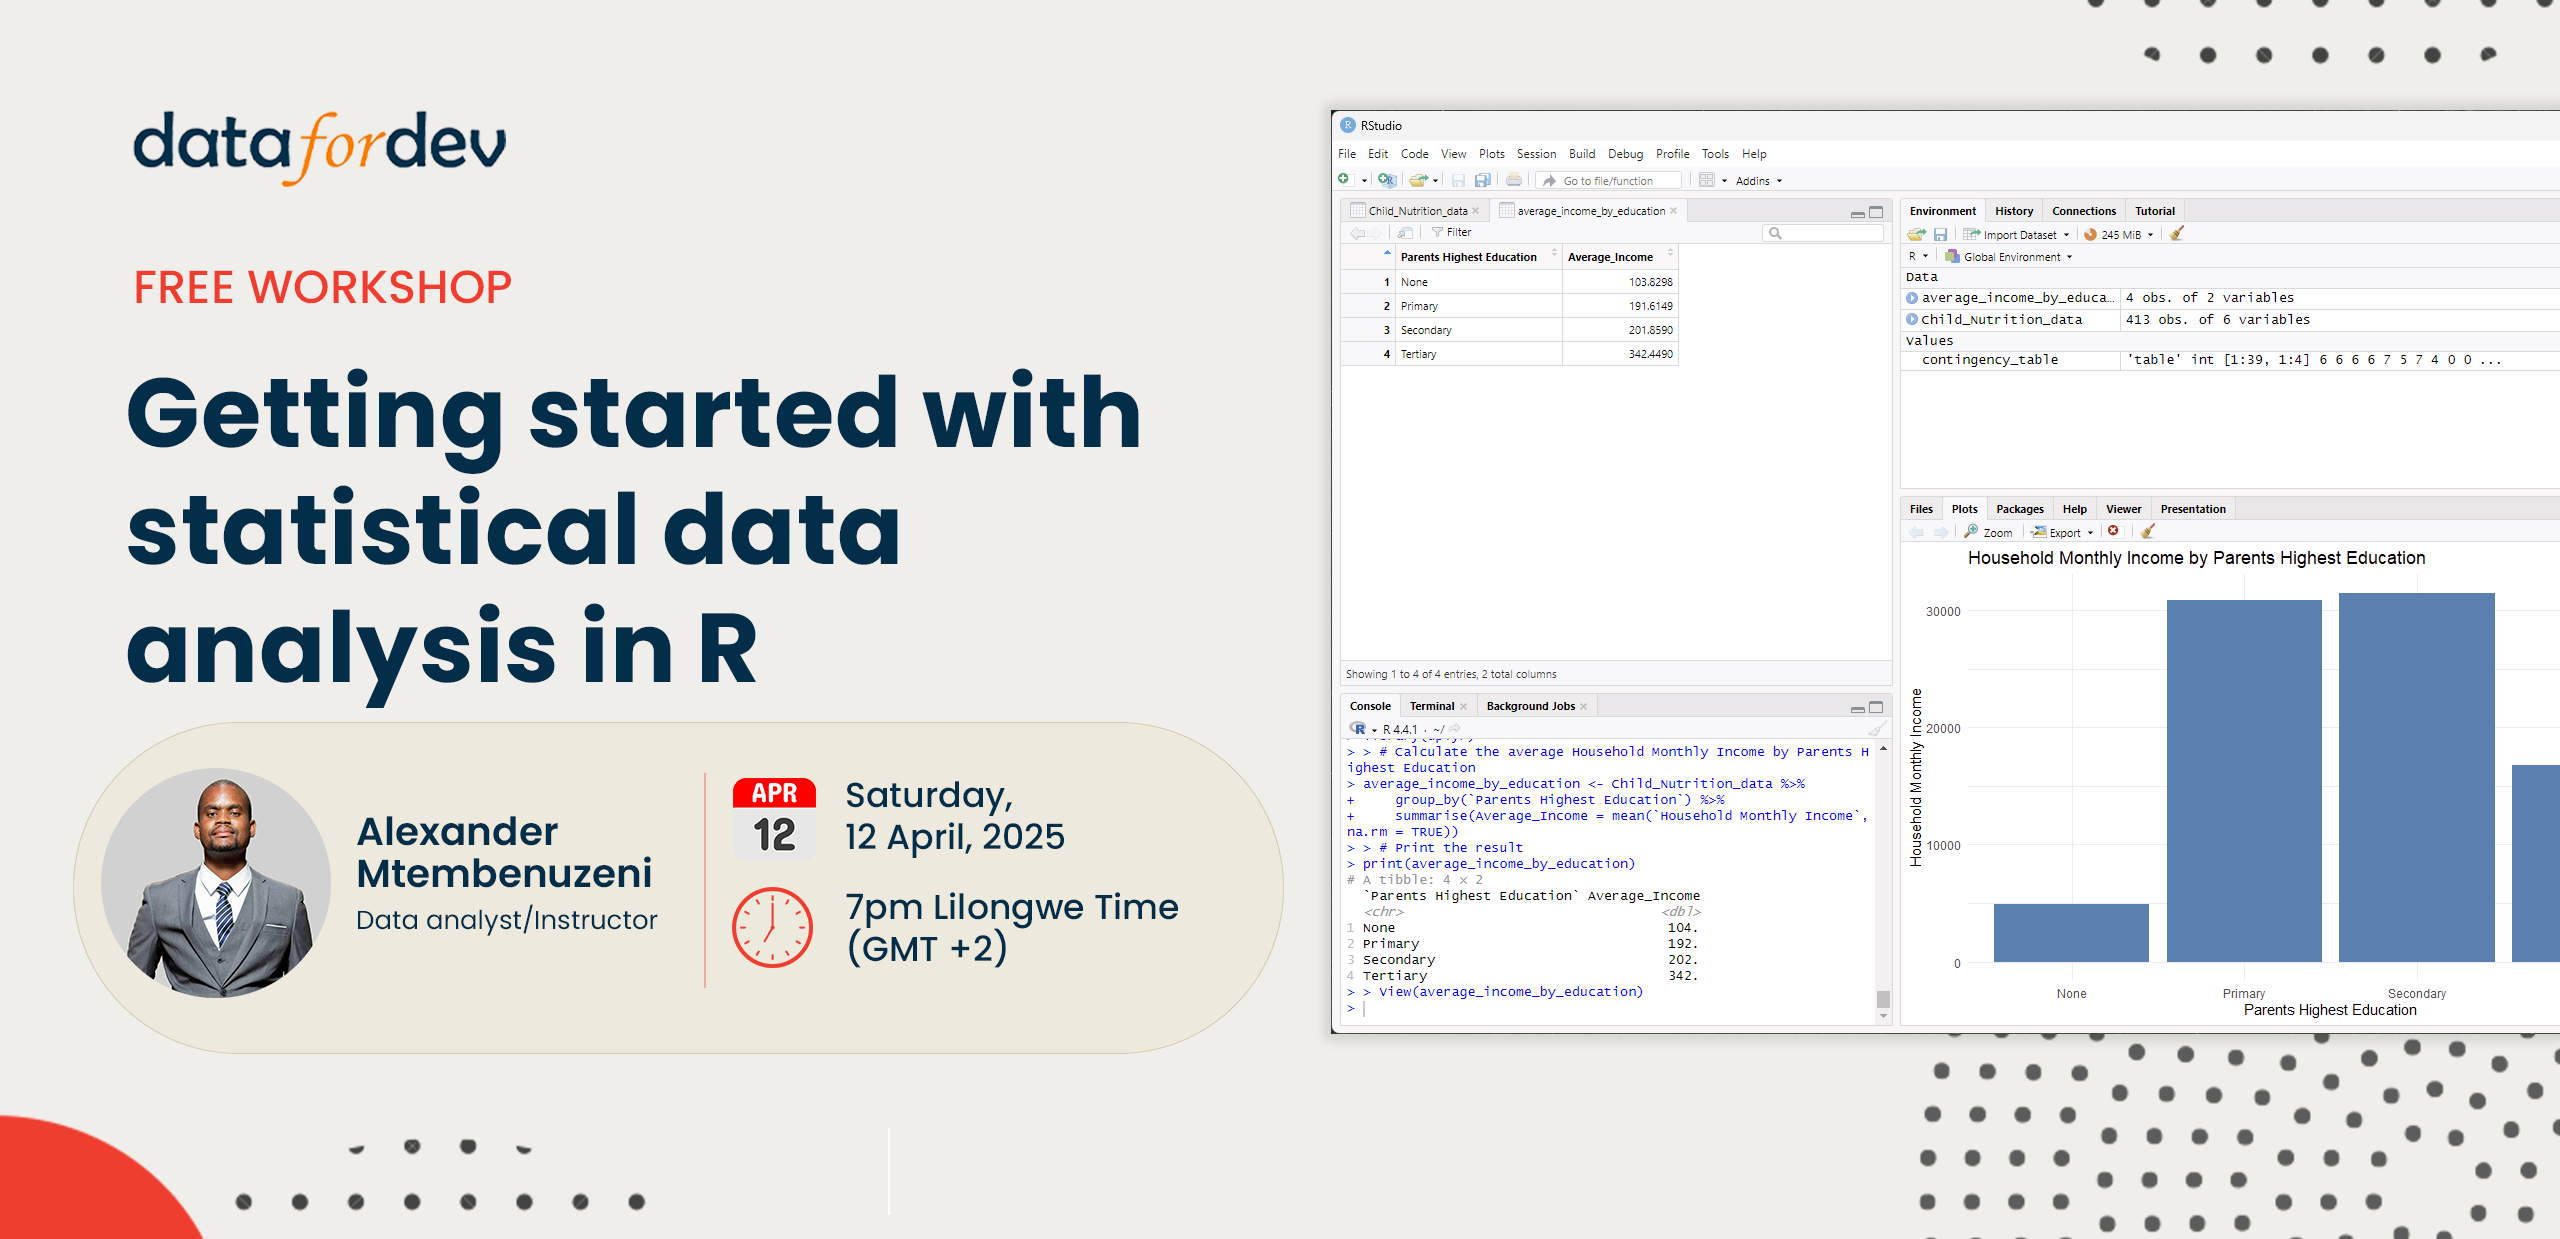
Key learning outcomes
- Install and navigate R and RStudio, understanding their key functionalities.
- Install essential packages for statistical analyses
- Import and clean data from Excel or CSV files into R for analysis.
- Summarize categorical data using frequency tables and visualize it with bar charts.
- Calculate descriptive statistics (mean, median, standard deviation) for continuous data and create histograms.
- Perform basic statistical tests, such as t-tests, to compare means between groups.
- Interpret and report summary statistics effectively for decision-making.
Course Outline
Introduction and Setup
- What is R and RStudio?
- Installing R and RStudio
- Introduction to the RStudio Interface
- Installing and loading packages
2. A Primer on Statistics
- What is Statistics?
- Types of Data
- Branches of Statistics
3. Getting Data into R
- Importing Data from Excel or CSV Files
- Basic Data Cleaning
4. Summarizing Categorical Variables
- Frequency Tables
- Bar Charts
5. Summarizing Continuous Variables
- Measures of Central Tendency
- Measures of Dispersion
- Histograms
- Summary Statistics
6. Comparing Means
- Group-wise Comparisons with
stby
Who should attend
- Absolute beginners who have no prior experience with R or statistics but want to get started with data analysis.
- Students in any discipline looking to enhance their data analysis skills for coursework or research projects.
- Professionals in fields like business, marketing, healthcare, or social sciences who need to understand and work with data but have little to no coding experience.
- Anyone curious about data science and looking for a hands-on introduction to statistical analysis using R..

