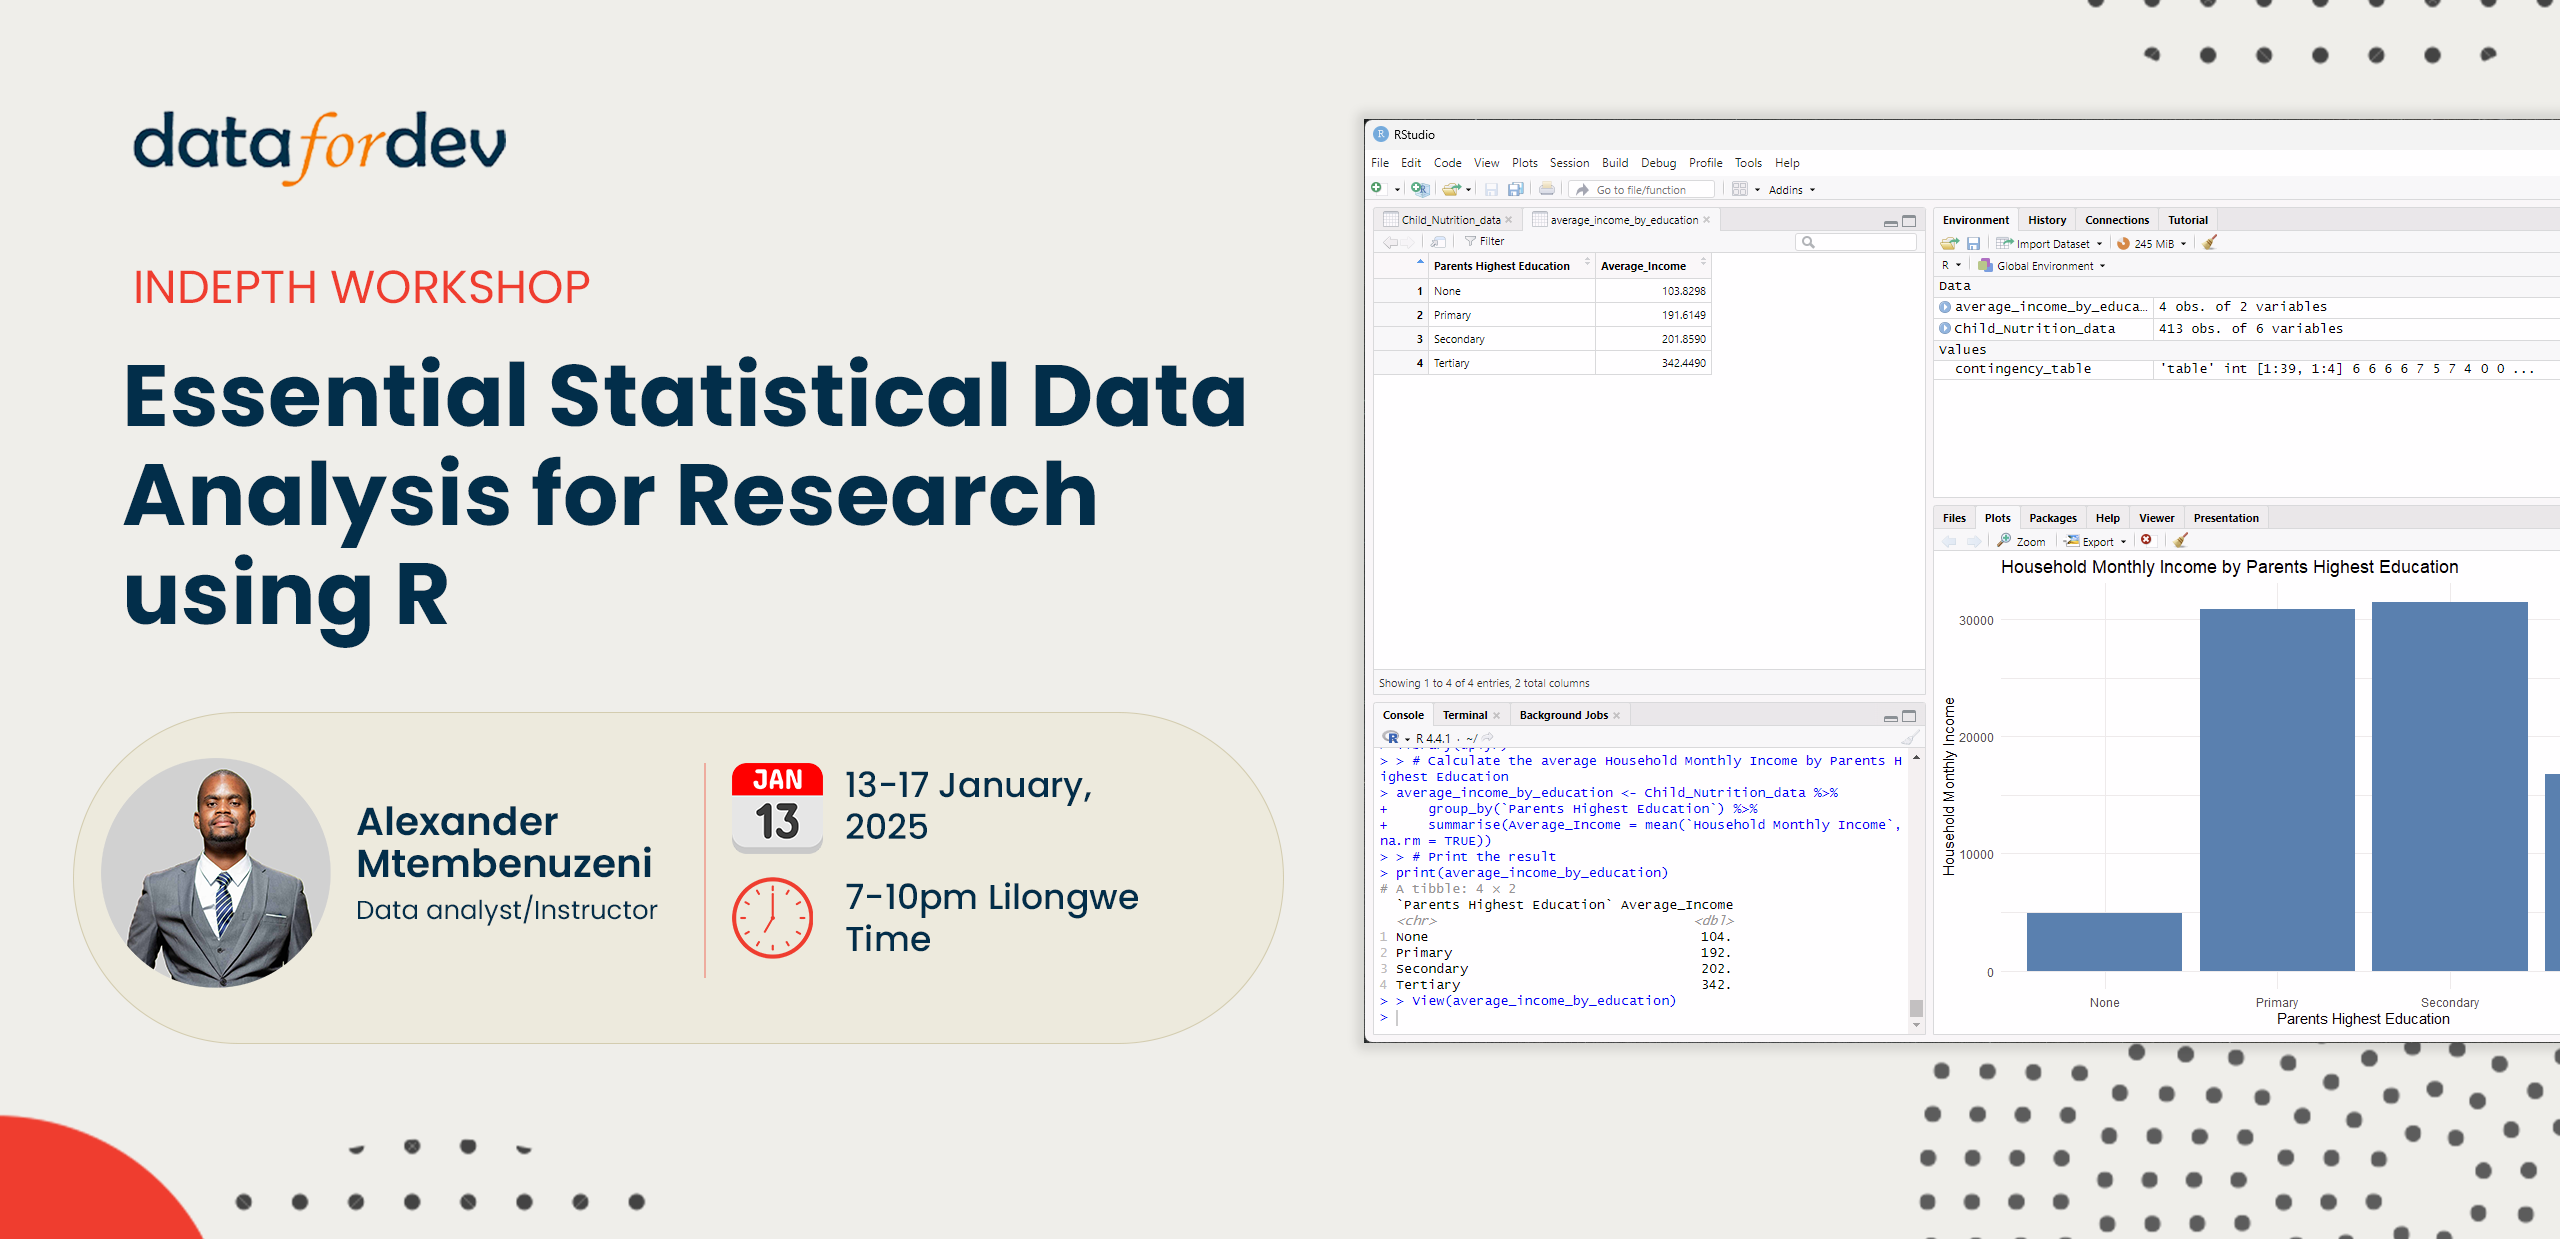
From data wrangling to statistical testing, learn how to transform raw data into meaningful insights using one of the world’s most powerful and free statistical computing platforms. This comprehensive course combines practical coding skills with statistical theory, enabling you to conduct professional-grade data analyses with confidence.
Key Learning Outcomes:
- Develop proficiency in R programming fundamentals and the RStudio environment
- Master essential data manipulation techniques for cleaning and preparing datasets
- Create professional-quality visualizations to communicate data insights effectively
- Perform and interpret fundamental statistical tests for research and business applications
- Execute advanced data wrangling operations for complex datasets
- Apply statistical methods to real-world problems using R’s powerful analytical tools
- Gain hands-on experience in exploratory data analysis and results interpretation
Course outline
Introduction to R software for statistical computing
- Overview of the R Studio IDE
- Installing, loading and updating R packages
- Creating objects in R
- Data types
- Data structures
- Sorting vectors and data frames
- Directory management commands
- Direct data entry in R (for small data sets)
- Importing data from other software
- Decision structures (if, if-else, if-else if-else)
- Repetitive structures (for and while loops)
- Other important programming functions (break, next, warn, stop)
Data Wrangling and Cleaning in R
- Working with variables
- Transform continuous variables to categorical variables
- Add new variables to data frames
- Handling missing values
- Sub-setting data frames
- Appending and merging data frames
- Spit data frames
- Stack and unstack data frames
Explanatory Data Analysis (EDA) in R
- Creating tables of frequencies and proportions
- Cross tabulations of categorical variables
- Descriptive statistics for continuous variables
Data Visualization using R base package
- Introduction to graphs and charts in R
- Customizing graph attributes (titles, axes, text, legends)
- Graphs for categorical variables
- Graphs for continuous variables
- Graphs to investigate relationship between variables
Mean Comparison Tests in R
- One Sample T Test
- Independent Samples T Test
- Paired Samples T Test
- One-way analysis of variance (ANOVA)
Tests of Associations in R
- Chi-Square test of independence
- Pearson’s Correlation
- Spearman’s Rank-Order Correlation

