Key Learning Outcomes:
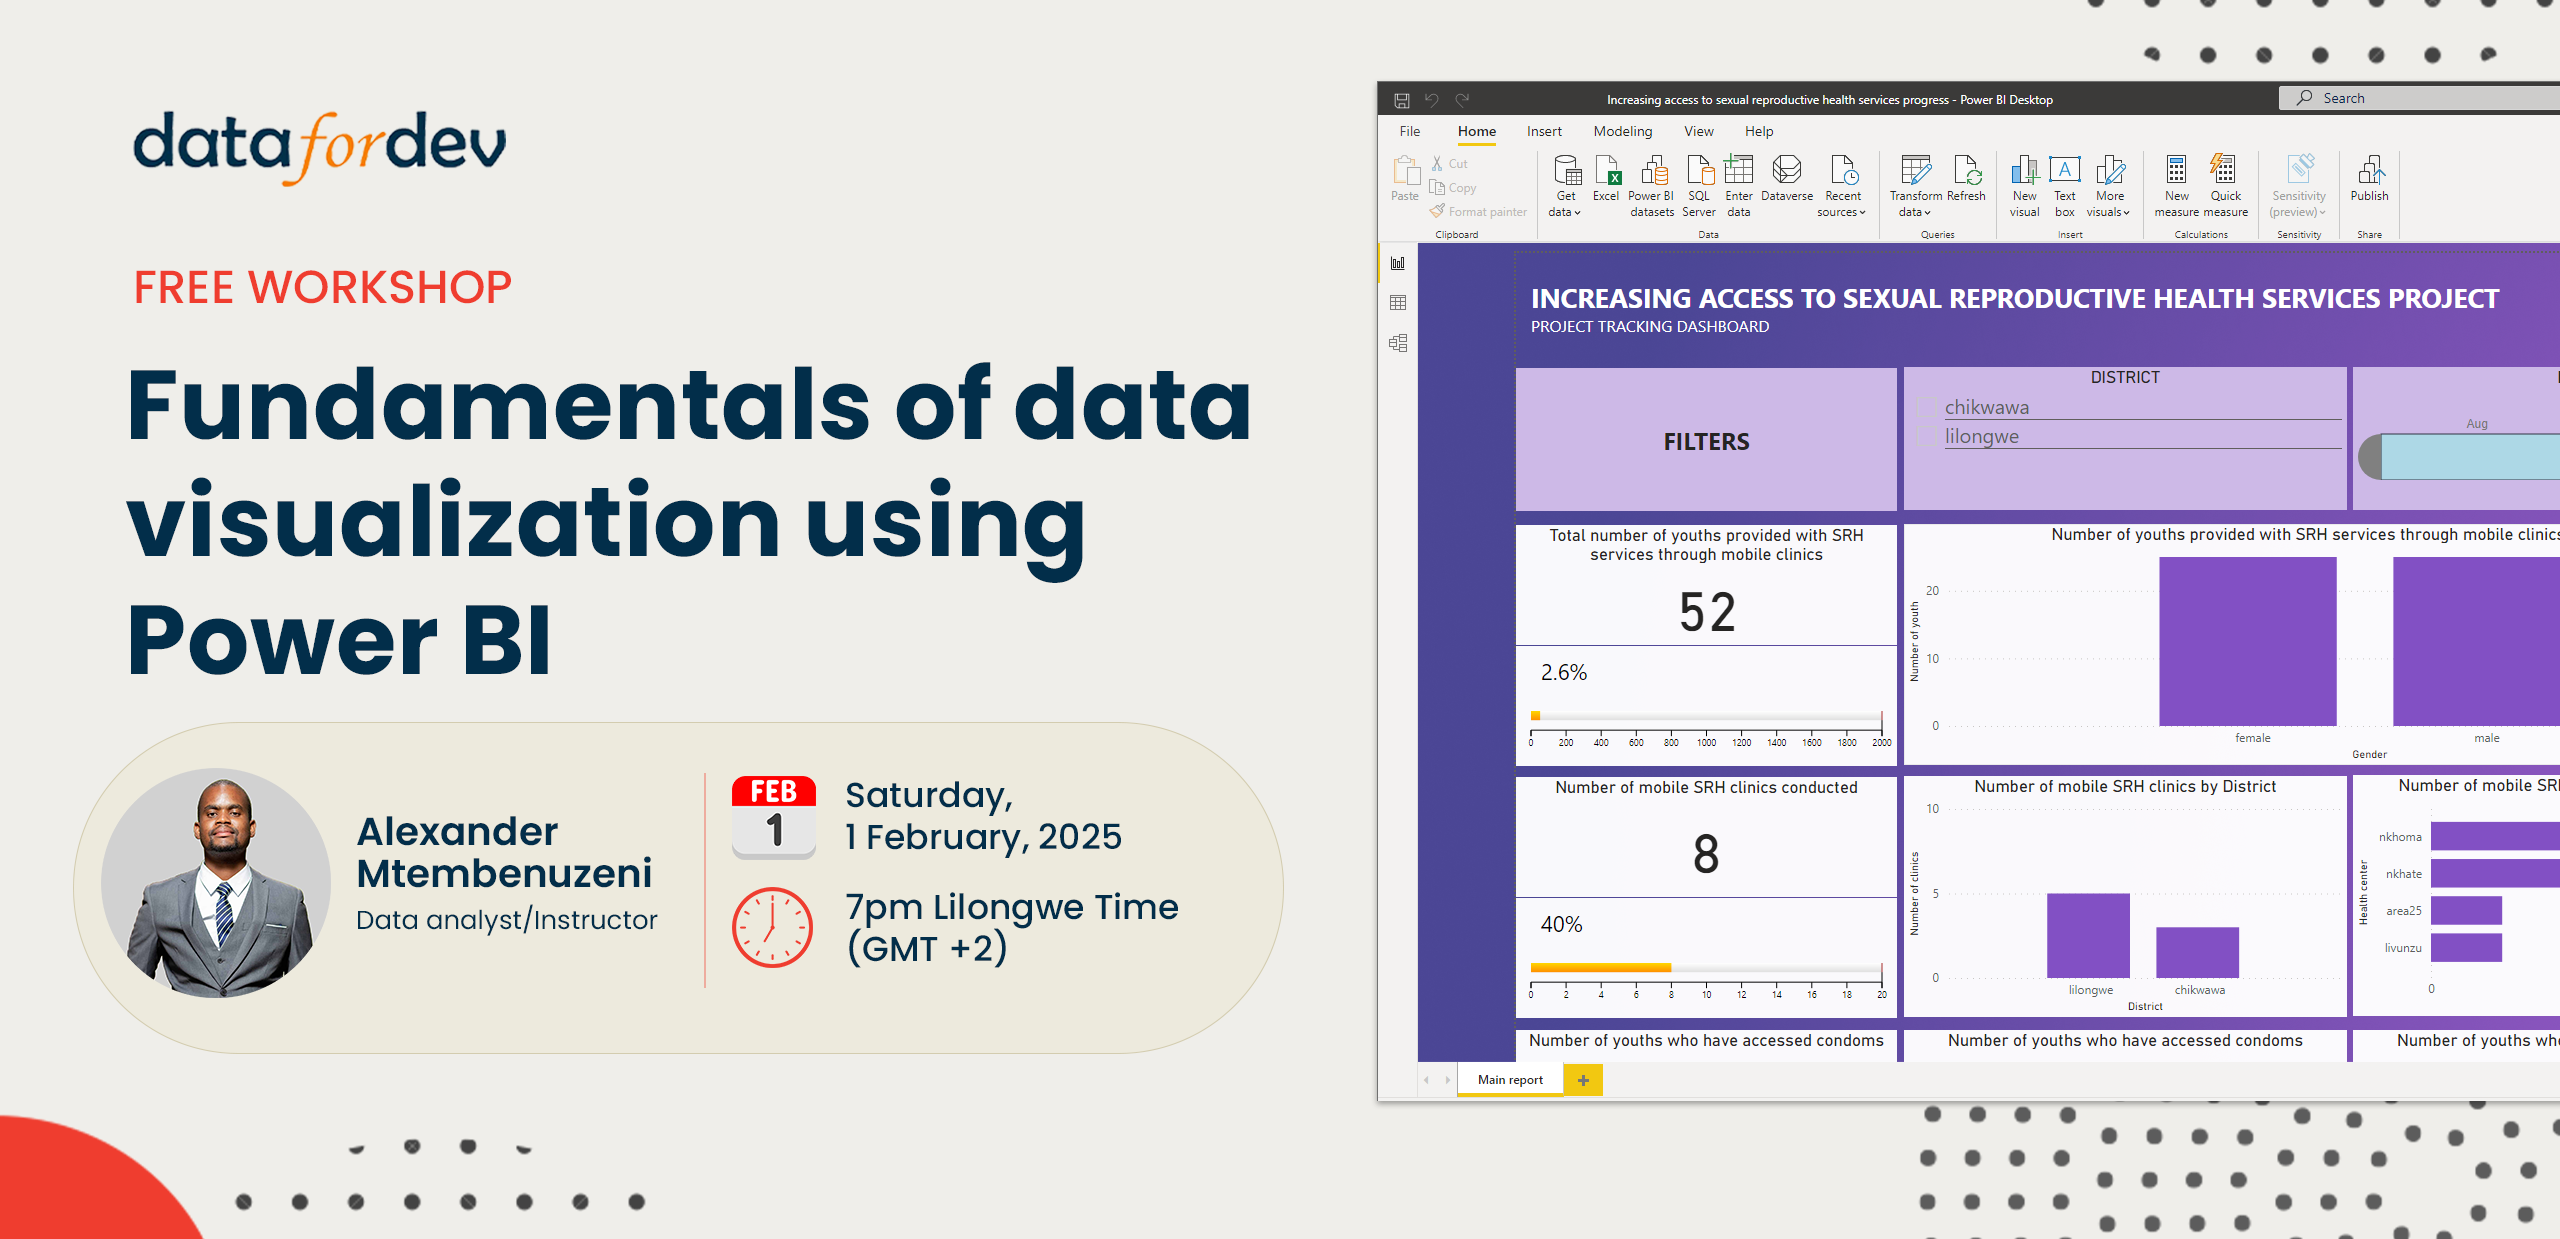
This hands-on workshop will guide you through the essentials of Power BI, from connecting to data sources to creating and sharing stunning visual reports. Here’s what you can expect:
- Confidently navigate the Power BI interface.
- Connect to various data sources and perform basic transformations.
- Create impactful visualizations that clearly communicate insights.
- Customize your visuals and reports for professional presentations.
- Share your reports using the Power BI service.
Course outline
- Getting started with Power BI
- Installing Power BI
- The Power BI interface
- Connecting to data
- Connecting to Excel worksheets
- Basic data transformation
- Basic calculations using DAX
- Calculating new columns
- Calculating measures
- Developing visuals
- Cards
- Bar and column charts
- Pie chart
- Line charts
- Table and matrix
- Slicer
- Customizing visuals and canvas
- Formatting visual elements
- Copying formats across visuals
- Customizing the report canvas
- Applying filters to visuals
- Sharing your visuals
- Getting started with the Power BI service
- Publishing reports Power BI service
- Sharing reports
Who should attend
- Complete beginners who have no prior experience with Power BI or data visualization tools.
- Business professionals who want to enhance their decision-making by creating insightful reports.
- Analysts looking to add Power BI to their toolkit for more effective data analysis.
- Anyone interested in learning how to visualize data in a clear, compelling way.

