Key Learning Outcomes:
- Master essential Excel functions for data analysis in Project Monitoring and Evaluation.
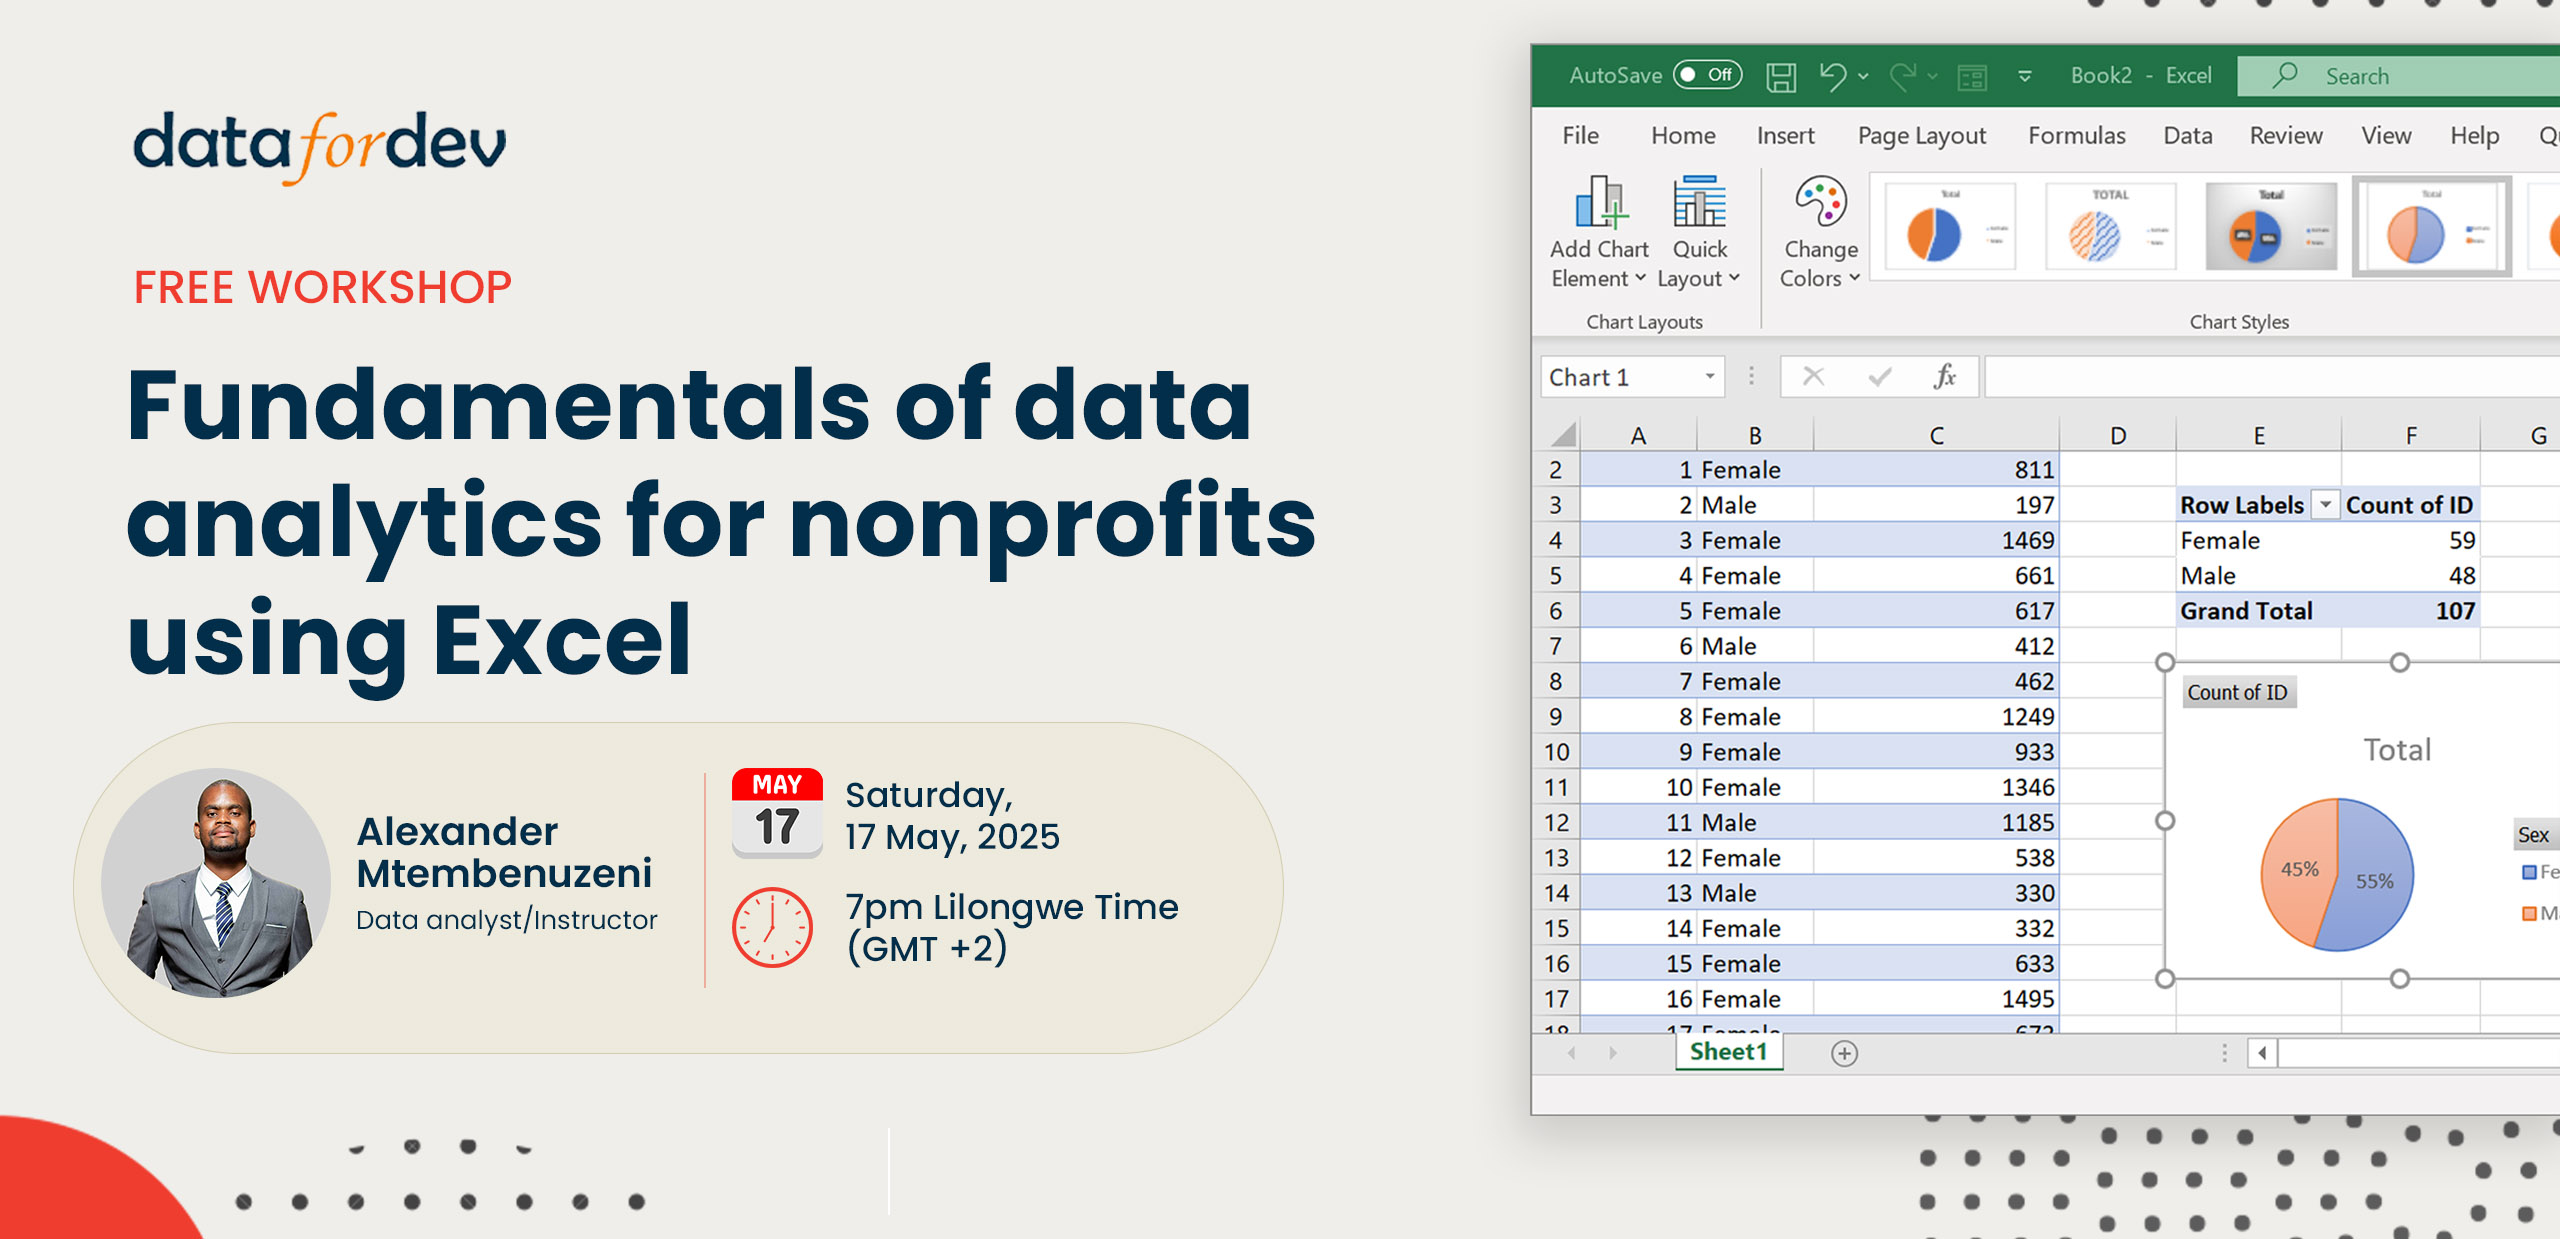
- Utilize tables and pivot tables to organize and analyze large datasets efficiently.
- Apply conditional formatting to highlight key data trends.
- Use advanced Excel functions like SUMIFS, COUNTIFS, for dynamic data analysis.
- Create insightful pivot charts to visualize project performance.
- Automate repetitive tasks to streamline data processing and reporting.
Course outline
Using tables
- Creating tables
- Sorting data
- Filtering data
- Calculating using Total row
- Calculated columns
Conditional formatting
- Introduction to conditional formatting
- Basic conditional formatting
- Custom conditional formatting
Data Analysis functions
- Introduction to functions in Excel
- SUM, SUMIF and SUMIFS
- AVERAGE, AVERAGEIF and AVERAGEIFS
- COUNTIF and COUNTIFS
Pivot Tables and Pivot Charts
- Introduction to pivot tables
- Inserting pre-made pivot tables
- Converting pivot tables to pivot charts
- Developing custom pivot tables and pivot charts
Who should attend
- Project managers and evaluators who need to analyze project data.
- Monitoring and Evaluation (M&E) professionals seeking to enhance their data analysis skills.
- Data analysts working in project management or development sectors.
- Anyone responsible for tracking project performance and outcomes using Excel.

