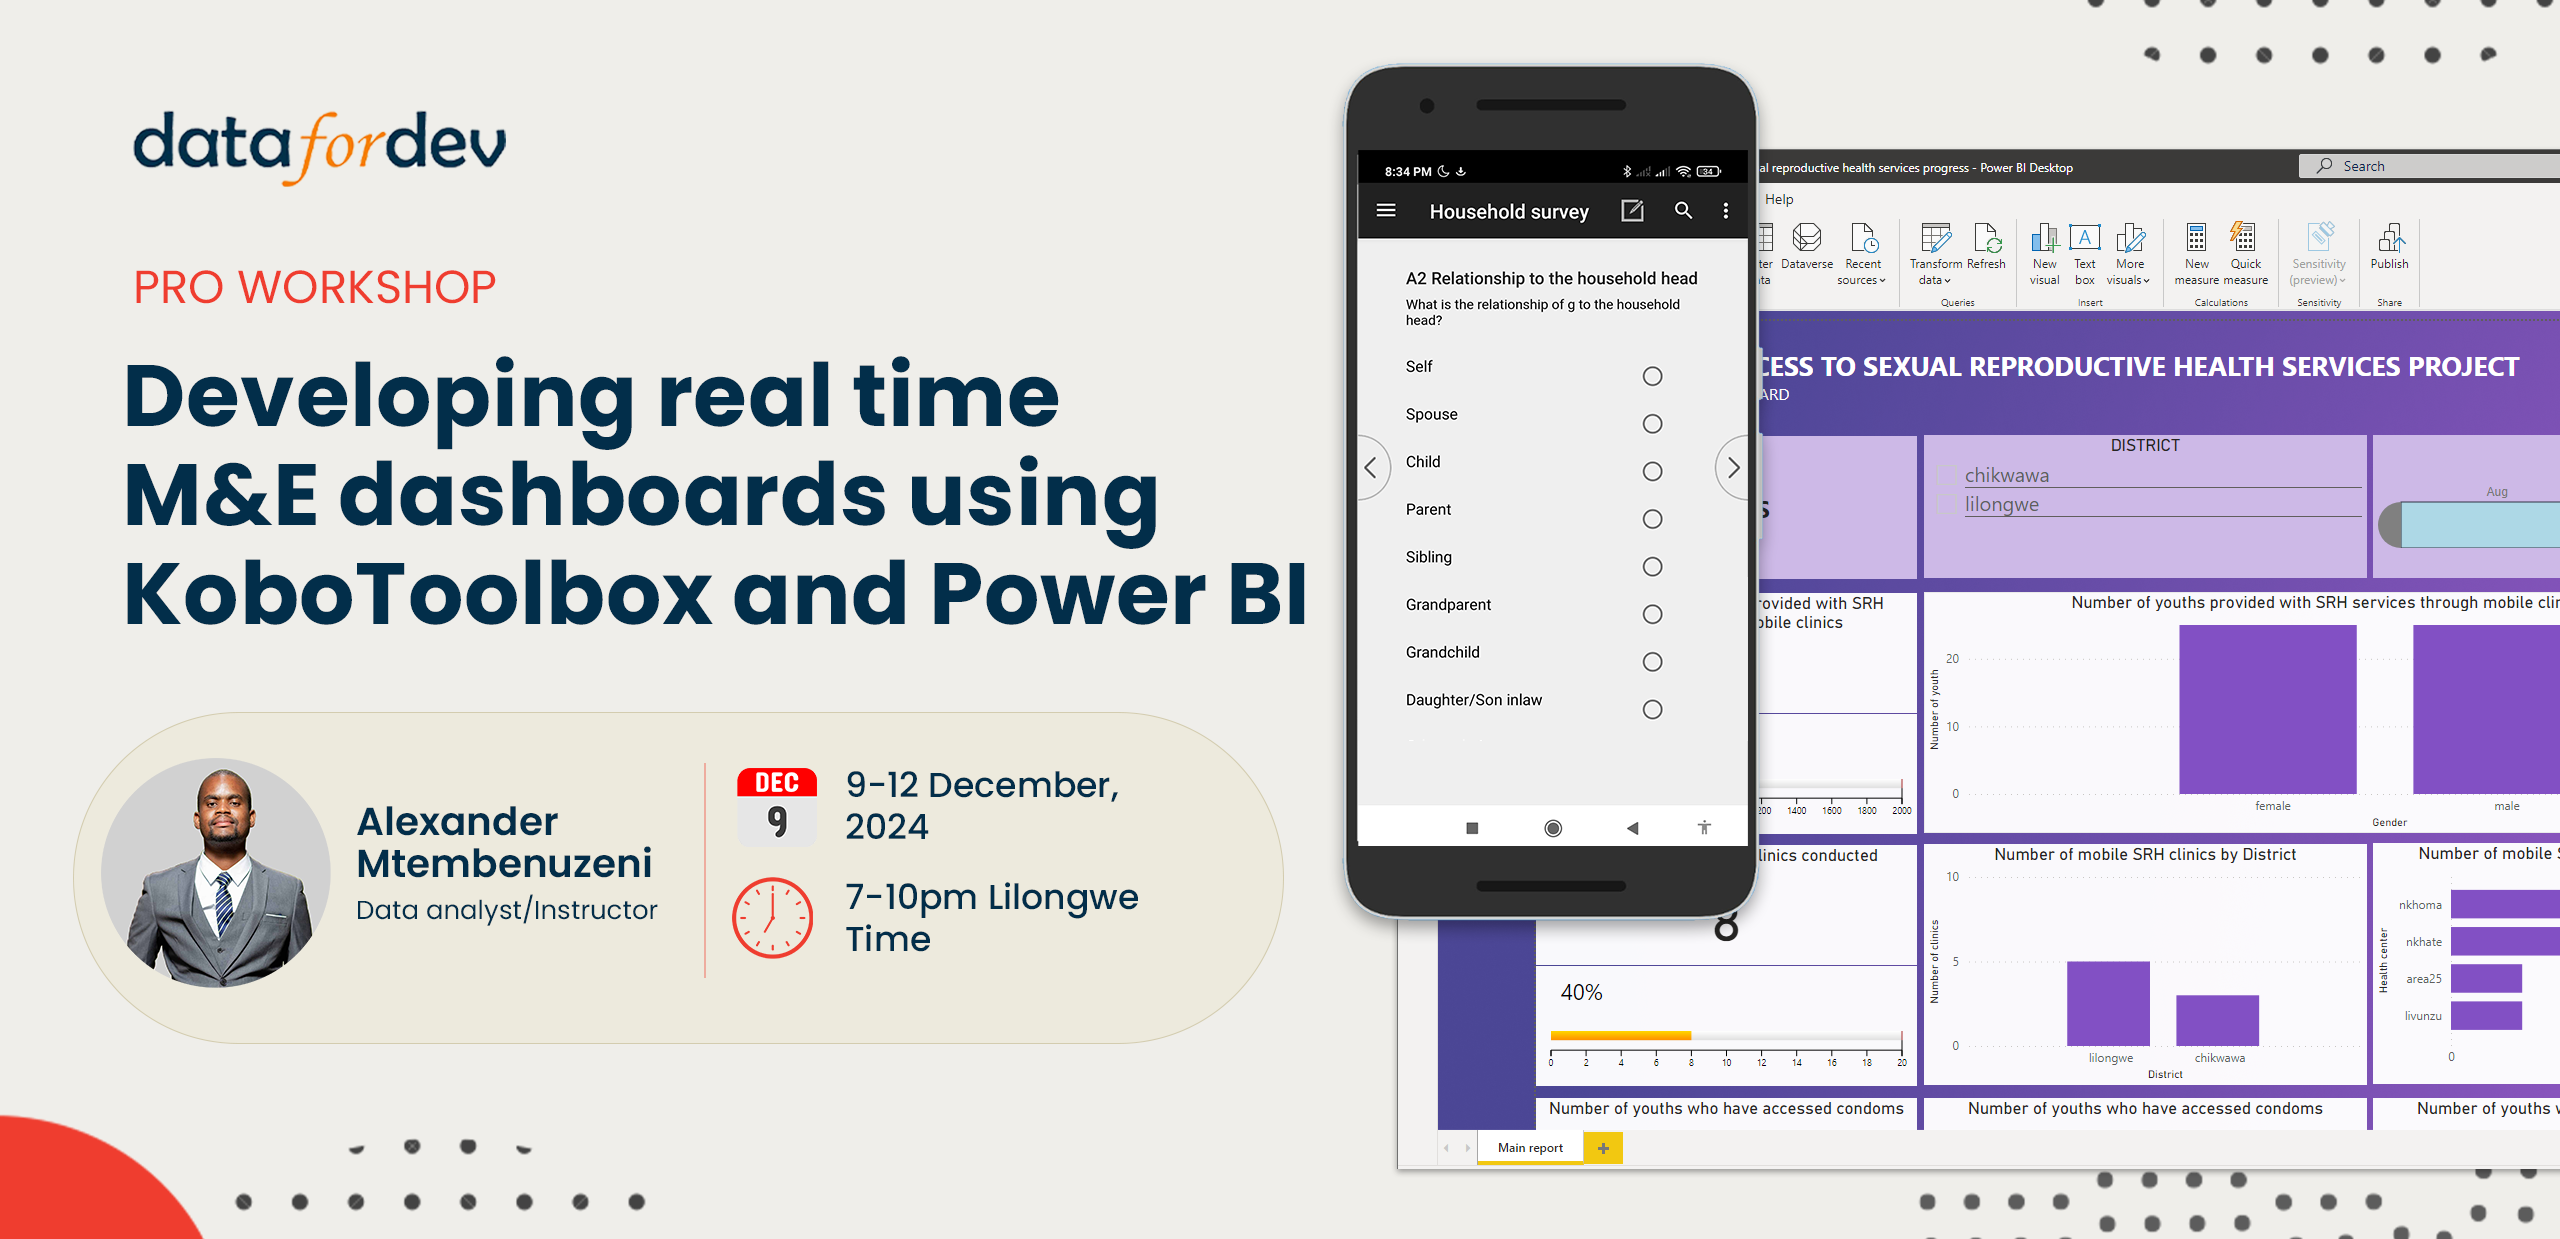
This practical, step-by-step course takes you from basic form creation to deploying professional-grade M&E dashboards that update automatically with your latest field data.
Key Learning Outcomes:
After completing this workshop, participants will be able to:
- Design and deploy mobile-friendly data collection forms using KoboToolbox that align with their M&E framework
- Configure secure API connections between KoboToolbox and Power BI for automated data flow
- Transform and model raw field data into structured datasets ready for analysis
- Create interactive dashboards with dynamic visualizations including trend analysis, progress tracking, and comparative metrics
- Implement real-time dashboard refresh mechanisms to ensure up-to-date reporting
- Apply best practices in dashboard design to effectively communicate program progress and results
- Build comprehensive M&E dashboards that track progress against targets and support data-driven decision making
Course outline
- Introduction
- Course intro
- Course orientation
- Step 1: Review your M and E framework and data collection tools
- The case study
- A walk-through of the M and E framework
- A walk-through of the reporting form
- Step 2: Create the data collection form in KoboToolbox
- Create the form in KoboToolbox
- Deploy the form to mobile devices, collect data and upload it
- Exploring the data in the KoboToolbox platoform
- Step 3: Connect, transform, and model data
- Getting the API URL
- Importing KoboToolbox data to Power BI
- Exploring and cleaning the data
- Creating calculated columns
- Creating measures
- Step 4: Build and share the dashboard
- Adding visuals
- Customizing the visuals
- Comparisons using column charts and pie charts
- Visualizing trends using the line chart
- Adding filters
- Visualizing progress towards targets
- Putting the dashboard together
- Refreshing the dashboard
Who should attend
This workshop is ideal for:
- M&E Officers and Managers seeking to automate their reporting processes
- Program Managers who need real-time visibility into project performance
- Data Analysts working in development organizations or NGOs
- Field Operations Managers responsible for monitoring program implementation
- Organizations transitioning from paper-based or basic digital data collection to automated dashboard systems
- Anyone involved in project monitoring who wants to reduce manual reporting effort and increase data visualization capabilities

