Microsoft Excel is one of, if not the number 1 data analysis software in the world in terms of popularity. This owes to how easy it is to use Excel, from entering data to cleaning your data, and summarizing your data. Excel even packs serious statistical analysis functionalities that come to par with the likes of SPSS and STATA. Choosing to work with Excel for data analysis is in most cases a very straight-forward decision to make since most people have at least worked with Excel for at some level. In this article, I will round up the top Excel features for data analysis.
Pivot Tables

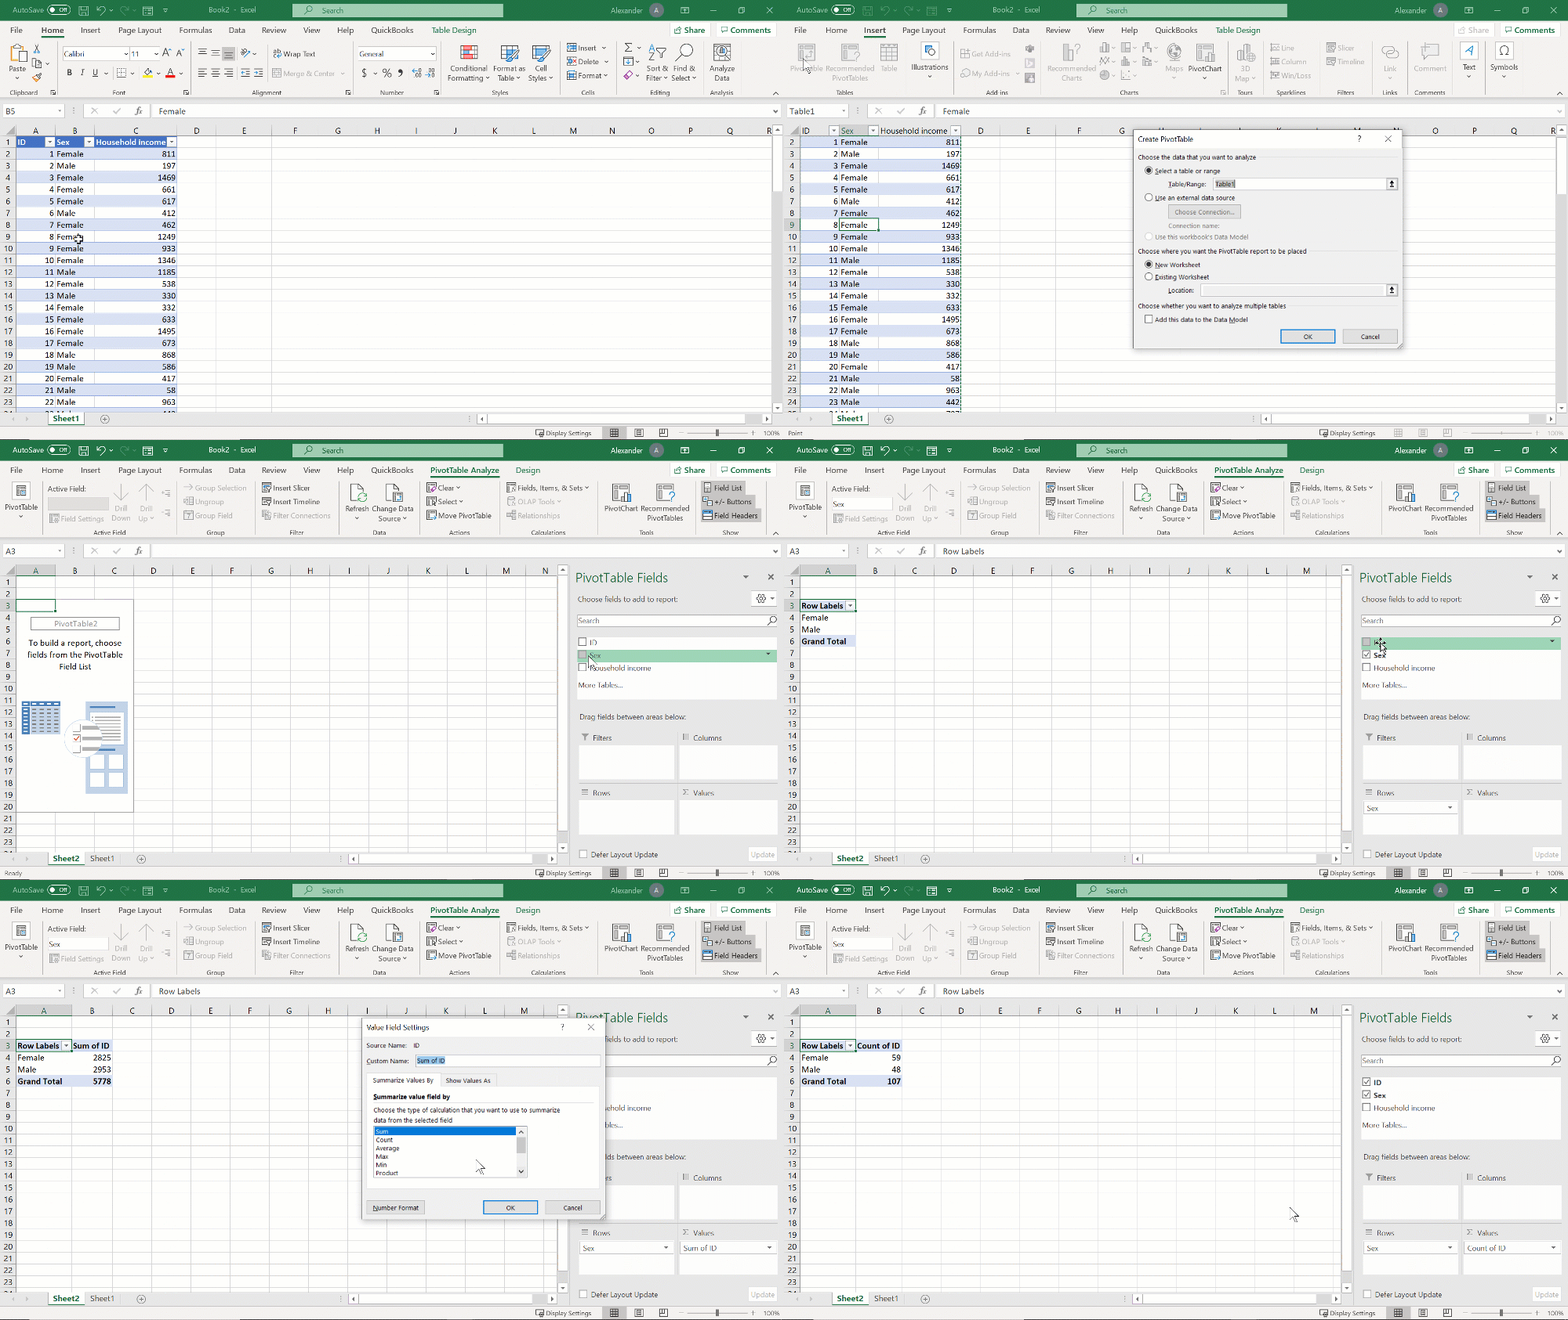
Perhaps the most powerful and most useful data analysis feature in Excel is the pivot table feature.
Pivot tables allow you to summarize large volumes of structured data very easily by generating summary tables. Using pivot tables, you can summarize data using counts (frequencies), mean, standard deviation, SUM and many other data analysis functions. Your summary values can then be disaggregated using date/time or text fields.
For example, you can build a pivot table summarizing household income, with average household income as the summary value, and disaggregate it by educational level.
Pivot tables also offer interactive features such filters, slicers and timelines for filtering the data in the table. These, together with the ability to sort the data provide an experience that can be likened to a data dashboard. In fact, pivot tables are in most cases used as part of a data dashboard in Excel.
Pivot Charts

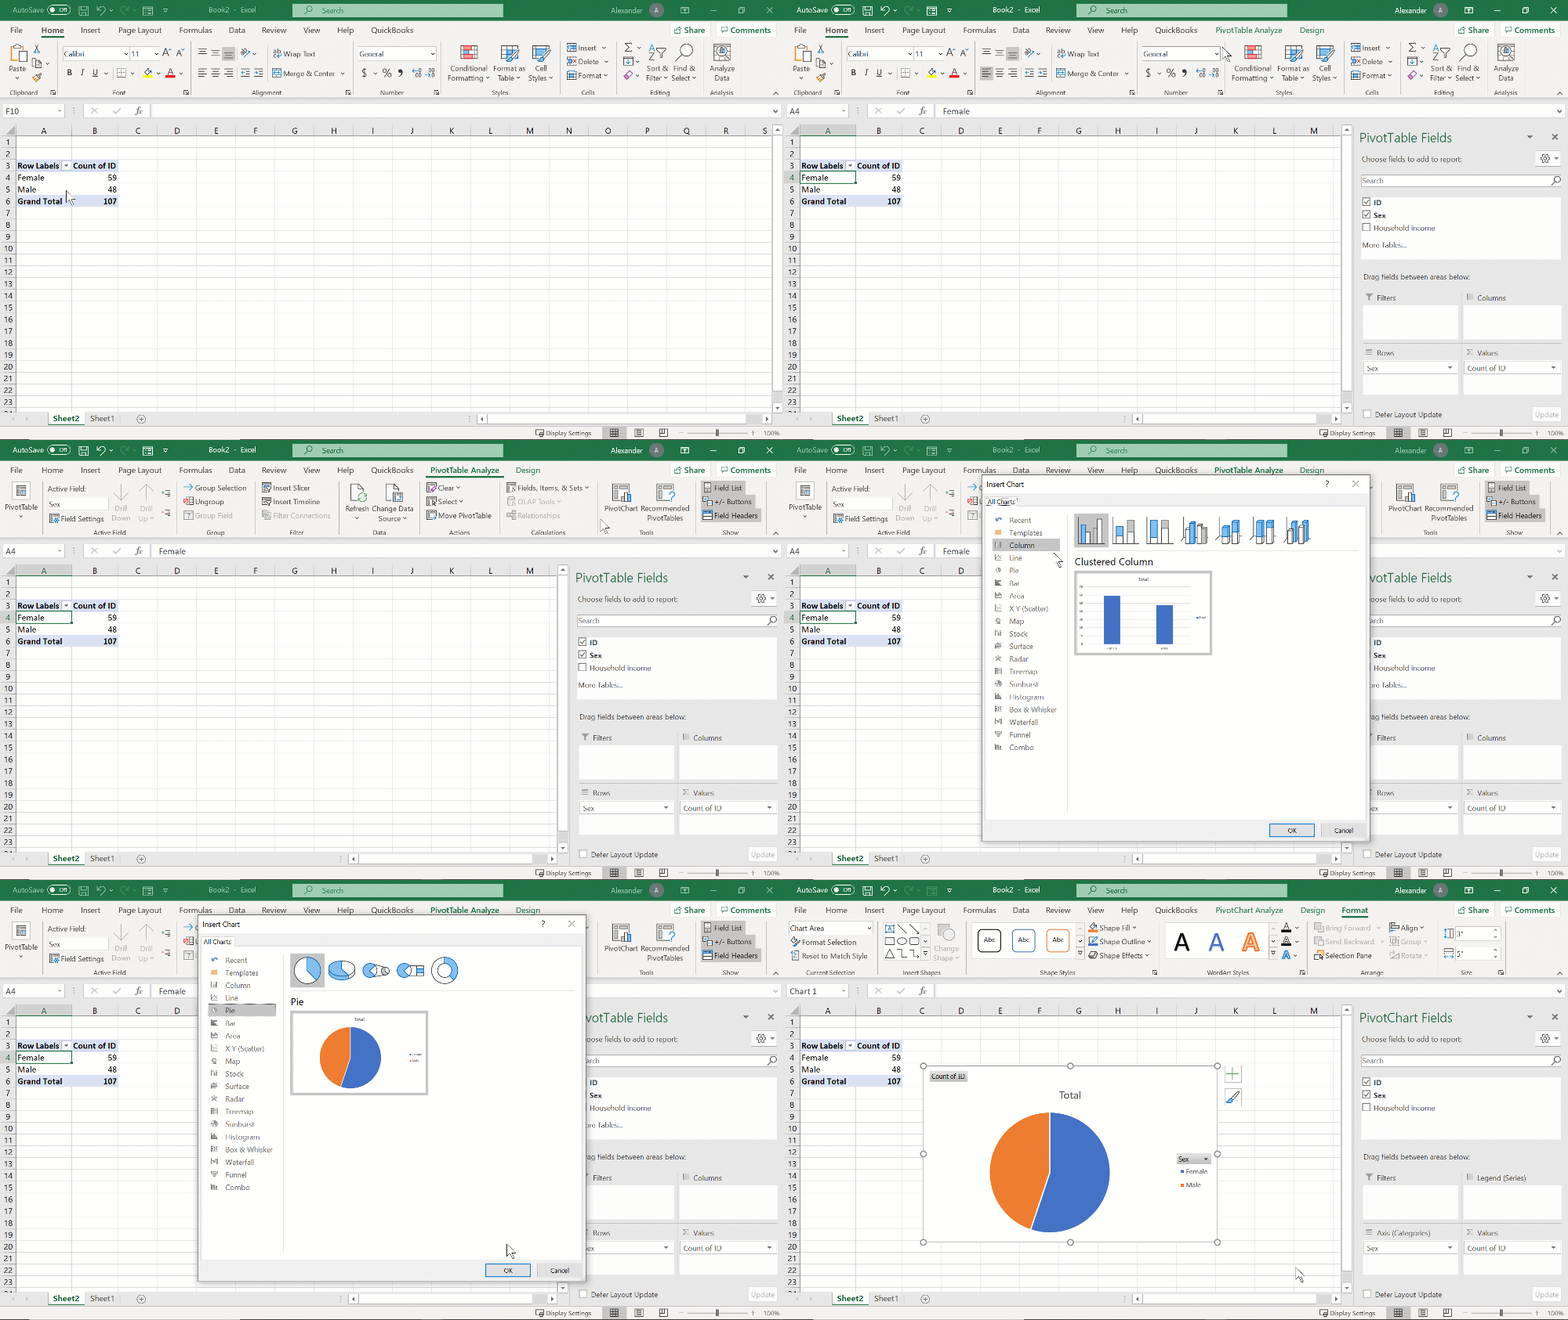
You can turn any pivot table into a chart such as a pi chart, column/bar chart, scatter plot or any one of the dozens of charts available in Excel. When you do this, the chart is called a Pivot chart.
The difference with a normal chart in Excel is that Pivot charts are dynamic just like pivot tables. You can use filters, slicers, timelines, and sorting with pivot charts.
Again, with this level of interactivity, pivot charts are used in combination with pivot tables to make a data dashboard.
Formulas
Microsoft Excel is known for its expansive list of pre-made calculations known as functions. Functions can do simple arithmetic operations like adding (SUM), or counting (COUNT); but can also do advanced statistical calculations like chi square and regressions. Here are the most commonly used functions you can use for data analysis:
SUM, AVERAGE, MIN, and MAX
When it comes to summarizing individual fields (or variables), the most common functions are the SUM, AVERAGE, MIN and MAX functions.
The SUM function adds numbers from a range of cells. The AVERAGE function on the other hand calculates the mean from a range of cells. The MIN and MAX functions extract the lowest and the highest values from a range of cells respectively. With the highest and lowest values, you can calculate the range by simply subtracting the two values.
STDEV
The STDEV function returns the standard deviation from a range of cells. In later versions of Excel such as Excel for Office 365, the function was replaced by STDEV.P and STDEV.S which return the standard deviation based on population and the other based on a sample. In most cases in statistics, the appropriate standard deviation to use is the one that assumes the data is from a sample and not a population.
SUMIF and SUMIFS
The SUMIF function calculates a SUM (total) of values in a range of cells by a given condition. For example, if you have a data set with names of field officers and the number of beneficiaries each officer has contacted, you might want to calculate the total number of beneficiaries contacted but only for a specific region of the country. The SUMIF function will allow you to specify the region as a condition for filtering the data and adding only the number of beneficiaries contacted within that region.
When you have multiple conditions instead of one, the SUMIFS function is used.
AVERAGEIF and AVERAGEIFS
Similar to the SUMIF function, the AVERAGEIF function calculates the mean of values in a range of cells by a given condition.
For example, from a child health survey, you may want to calculate the average birth weight of only male babies. The SUMIF function will allow you to specify the gender as a condition for the function, thereby only returning the average of just the specified gender.
When you have multiple conditions, the SUMIFS function is used.
COUNTIF and COUNTIFS
If you need to count the number of records based on a condition, the COUNTIF and COUNTIFS functions are used.
For example, in a survey, you may need to count the number of females interviewed. When you have only one condition like this, you will use the COUNTIF function.
If you need to count the number of females who are married, you have two conditions involved. In this case, you will have to use the COUNTIFS function.
Add-ins
Apart from the built-in functions, Excel also has addons that can be used to analyze data. The add-ins extend the functionality of Excel with more powerful features. Here are some of the commonly used addons:
Data Analysis Pak
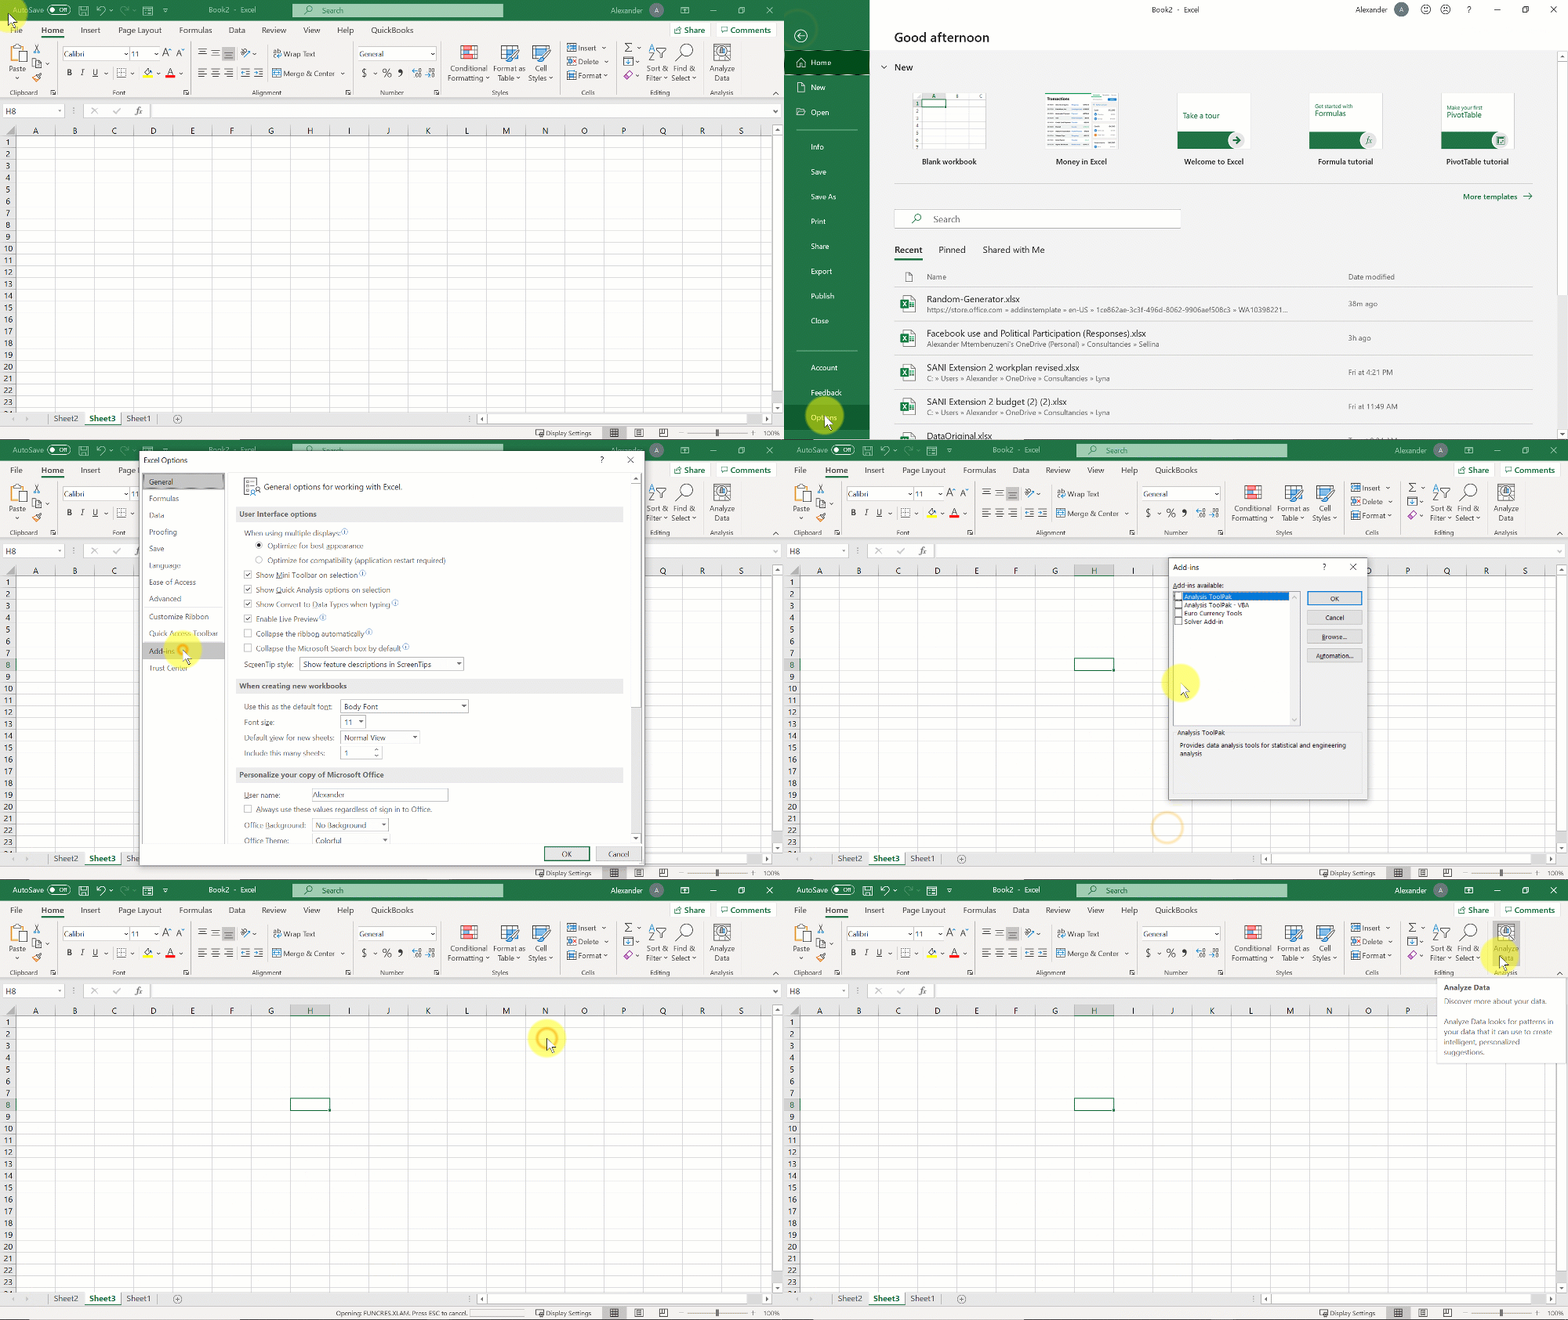
The Data Analysis Toolpak is an add-in that comes preinstalled in Excel. To start using the add-in, you must activate it by going to File -> Options -> Add-ins and click Go at the bottom of the dialog box to manage the add-ins. From there you will turn on the Analysis Toolpak and clicking OK.

Once the add-in has been activated, you will be able to access it from the Data tab.
With it you will be able to perform basic and advanced statistical analyses such as Descriptive statistics, Analysis of variance (ANOVA), correlations, t tests and regressions among many others.
BERT

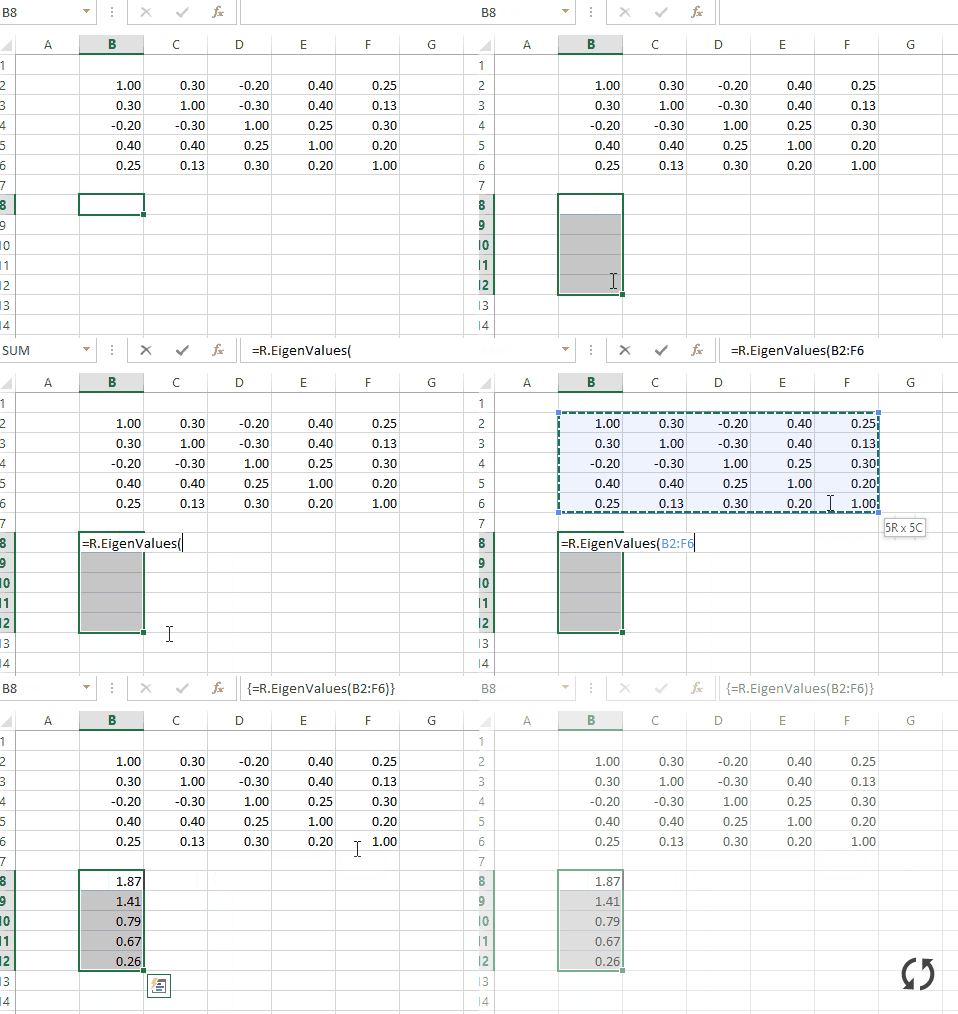
If you are experienced in data analysis using the r language and would like to work with r within Excel, you are in luck. The Basic Excel R Toolkit (BERT) is a free Excel add-in that allows you to write r functions within Excel with much ease.
The add-in connects r and Excel with easy, even allowing you to use a console to control Excel using r code.
You can download the add-in from the following link: https://bert-toolkit.com/
Summary
Microsoft Excel is one powerful software with an extensive list of functionalities that do many things including managing and analyzing data. Unlike specialized data analysis software such as SPSS and STATA, most people are quite familiar with using Excel in their work. This makes Excel a simple and convenient tool to learn for data analysis work. Luckily, Excel has many powerful data analysis features such as pivot tables, pivot charts and functions. If you need even more data analysis features, Excel allows you to extend it using add-ins such as the Analysis Toolpak.
