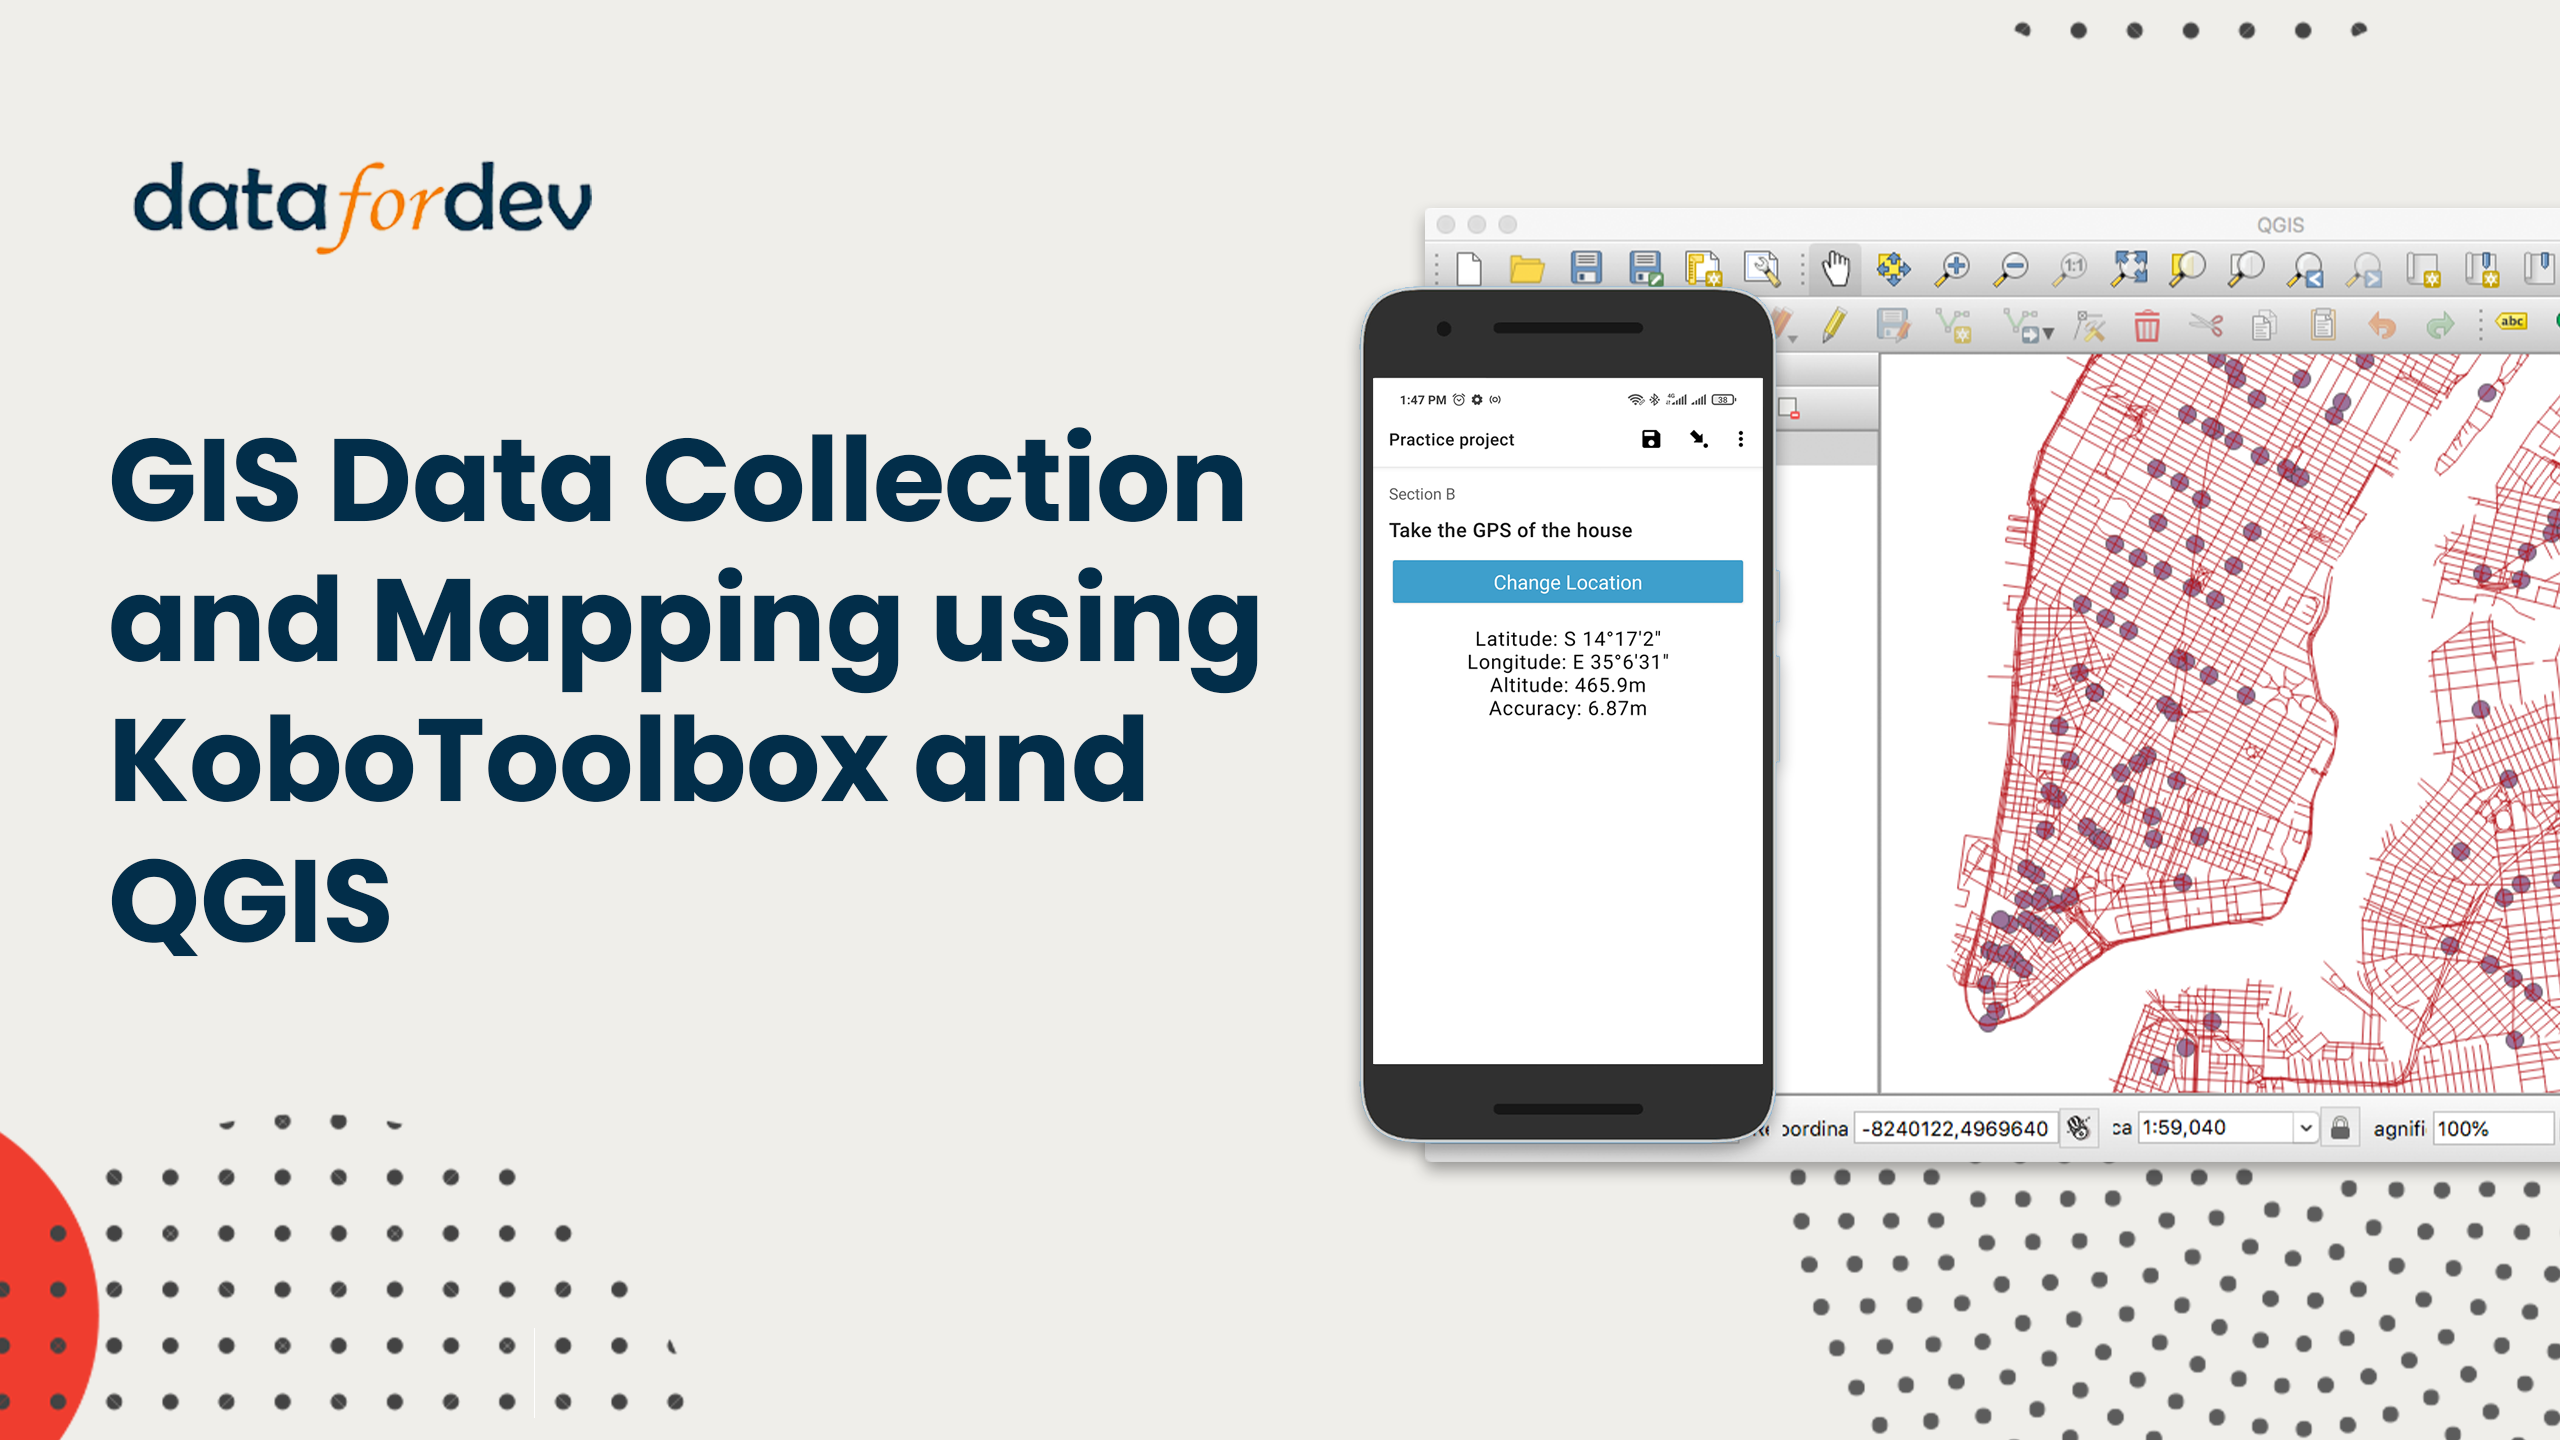
About this course
Are you ready to harness the power of GIS for social development and impact? Dive into our comprehensive course, “GIS Data Collection and Mapping using KoboToolbox and QGIS,” and become a pro at creating meaningful maps that drive change!
This course is meticulously designed to guide you through the essentials of Geographic Information Systems (GIS) and its significance in various social impact sectors. You’ll learn how to collect, manage, and visualize spatial data using the powerful duo of KoboToolbox for field data collection and QGIS for mapping and analysis.
What you’ll learn
- The fundamentals of GIS and its applications in public health, disaster response, urban planning, and more.
- How to navigate and utilize KoboToolbox features for efficient data collection.
- The process of creating, deploying, and managing GIS projects with real-world case studies.
- Techniques for adding logic to forms, ensuring data quality, and best practices for field data collection.
- The ins and outs of QGIS, including installation, interface navigation, and key features.
- How to work with different types of GIS data and sources, load basemaps, and explore vector data.
- Skills to build, label, and classify features on your map for clear and impactful visual communication.
- The art of creating thematic maps, layouts, and adding essential map elements like legends, scale bars, and north arrows.
- Exporting your maps in various formats for sharing and presentation.
- Real-time data syncing between KoboToolbox and QGIS using the QRealTime plugin.
- Basic map tools for calculating areas, distances, and selecting features.
Course content
Welcome
- Introduction
- Course orientation
Introduction to GIS and mapping
- Introduction to GIS
- GIS applications in Social Impact
- GIS data types
- Basics of coordinate systems and map projections
- Application of KoboToolbox in GIS work
- Understanding our case study
- Overview of the process
GIS data collection using KoboToolbox
- Overview of KoboToolbox
- Creating your project
- Adding logic to the form
- Deploying the project
- Setting up KoboCollect
- Collecting data in the field
- Uploading data to KoboToolbox
- Accessing data and exporting it
Getting started with QGIS
- Overview of QGIS
- Downloading and installing QGIS
- QGIS interface
Working with data in QGIS
- Sources of GIS data
- Loading basemaps
- Loading and exploring vector data
- Navigating the map
Building your map
- Labelling features
- Symbology
- Classification
- Rule-based classification
- Creating thematic maps
Packaging your map
- Creating a print layout
- Adding map elements
- Map elements part II
- Exporting the map
Connecting KoboToolbox with QGIS
- Getting started with the QRealTime plugin
- Connecting to KoboToolbox and inserting layers
Basic map tools
- Calculating areas and distances
- Finding and selecting features
Instructor

Alexander Mtembenuzeni
DATAFORDEV Founder
Alexander has over 10 years experience training social impact organizations in data analytics. He also has consulted for small and big organizations across the world – developing data collection tools, building M and E systems and analyzing data. He is a 4.6/5-rated instructor on Udemy.com where he has several courses with a combined over 15,000 students. He also loves blogging and creating tutorial videos for the Data for Development YouTube channel.
Frequently asked questions
Does this course offer a certificate?
Yes. You will automatically get a certificate of completion as soon as you complete the course
How long will it take for me to complete the course?
We recommend investing 2 hours of learning per day. With that time investment, you will finish the course including the hands-on practices in 7 days.
Which days and times does the course run?
This course is self-paced. Once you enroll, you can go through the learning content at any time, and at your own pace!

Instant access
Approximately 7 days to complete
Level
OR
