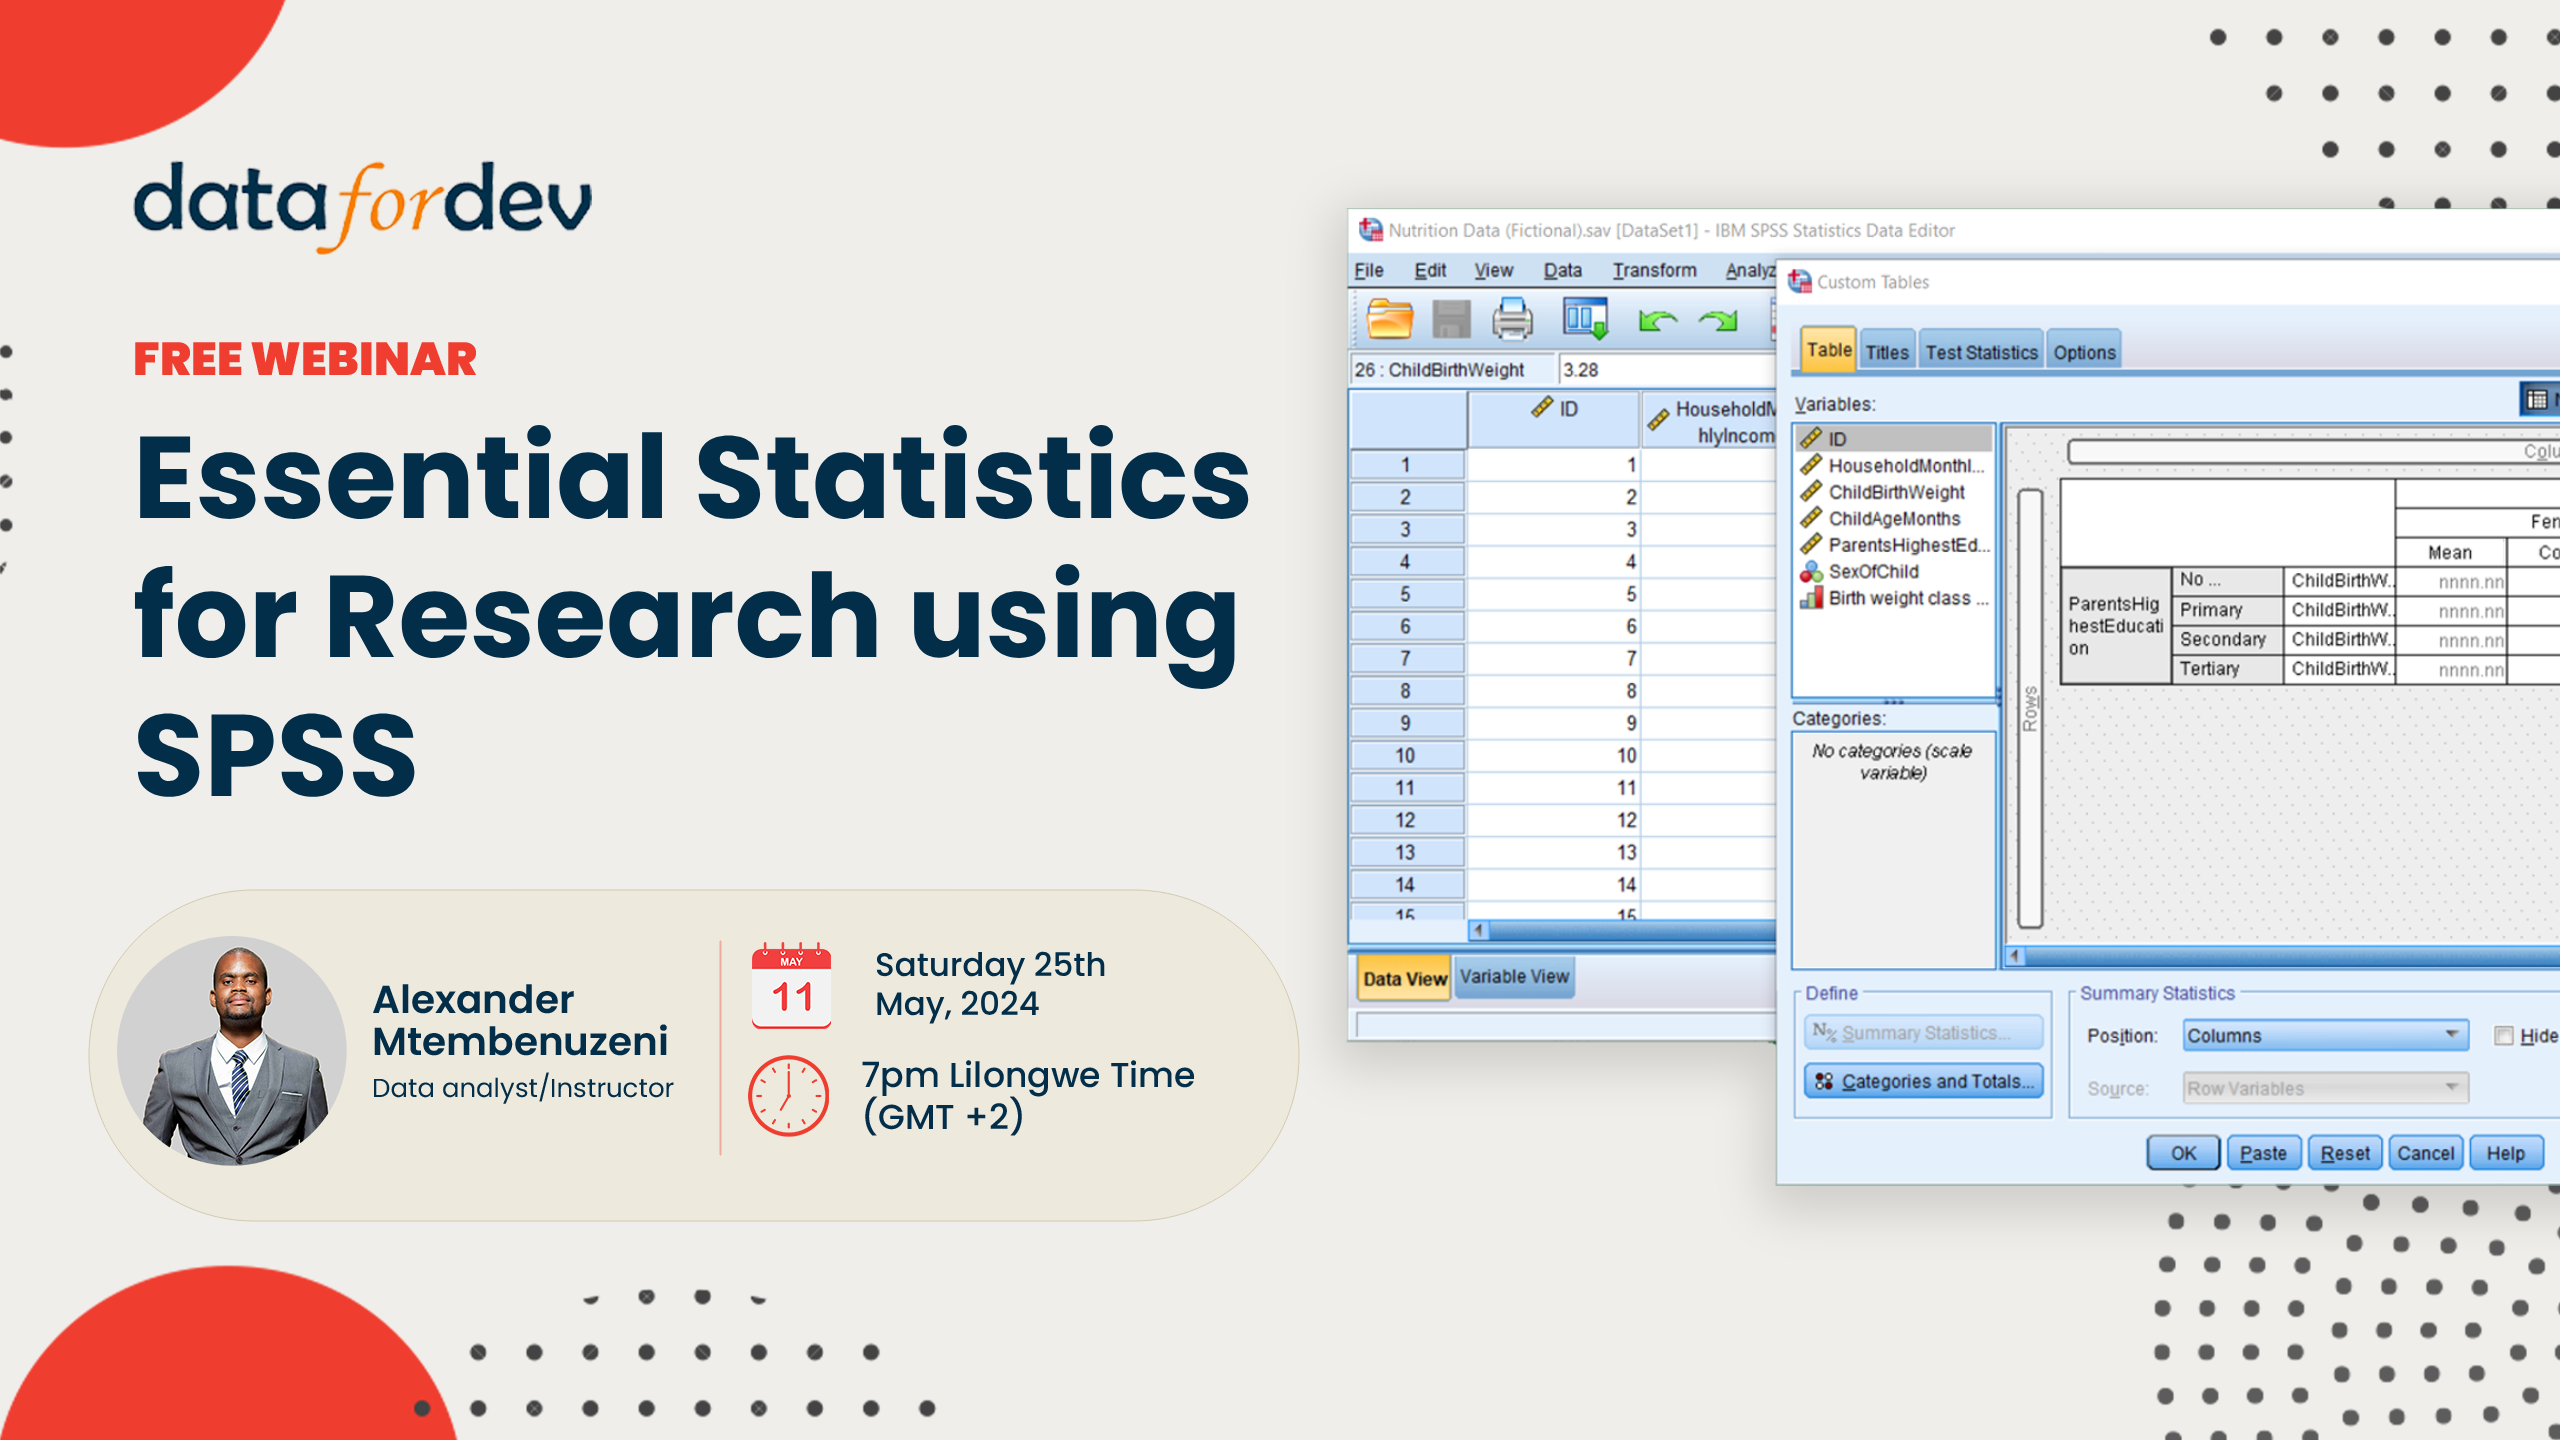
Free Workshop
Essential Statistics for Research using SPSS
Learn how to analyze, interpret and report research data using SPSS
Enrolment is closed

Date and Time
Saturday, May 25th· 7-9pm Lilongwe Time (GMT+2)
Location
Online on Microsoft Teams (register to view meeting link)
What will be covered in the workshop
Introduction
- What SPSS can do
- The SPSS interface
Getting data into SPSS
- Importing an Excel file into SPSS
- Editing variable properties
Summarizing categorical variables
- Producing frequency tables
- Creating bar and pie charts
- Interpreting and reporting frequencies and bar and pie charts
Summarizing continuous variables
- Producing summary statistics
- Creating histograms
- Comparison of means across groups
- Interpreting and reporting summary statistics
Enrolment is closed
