About this course
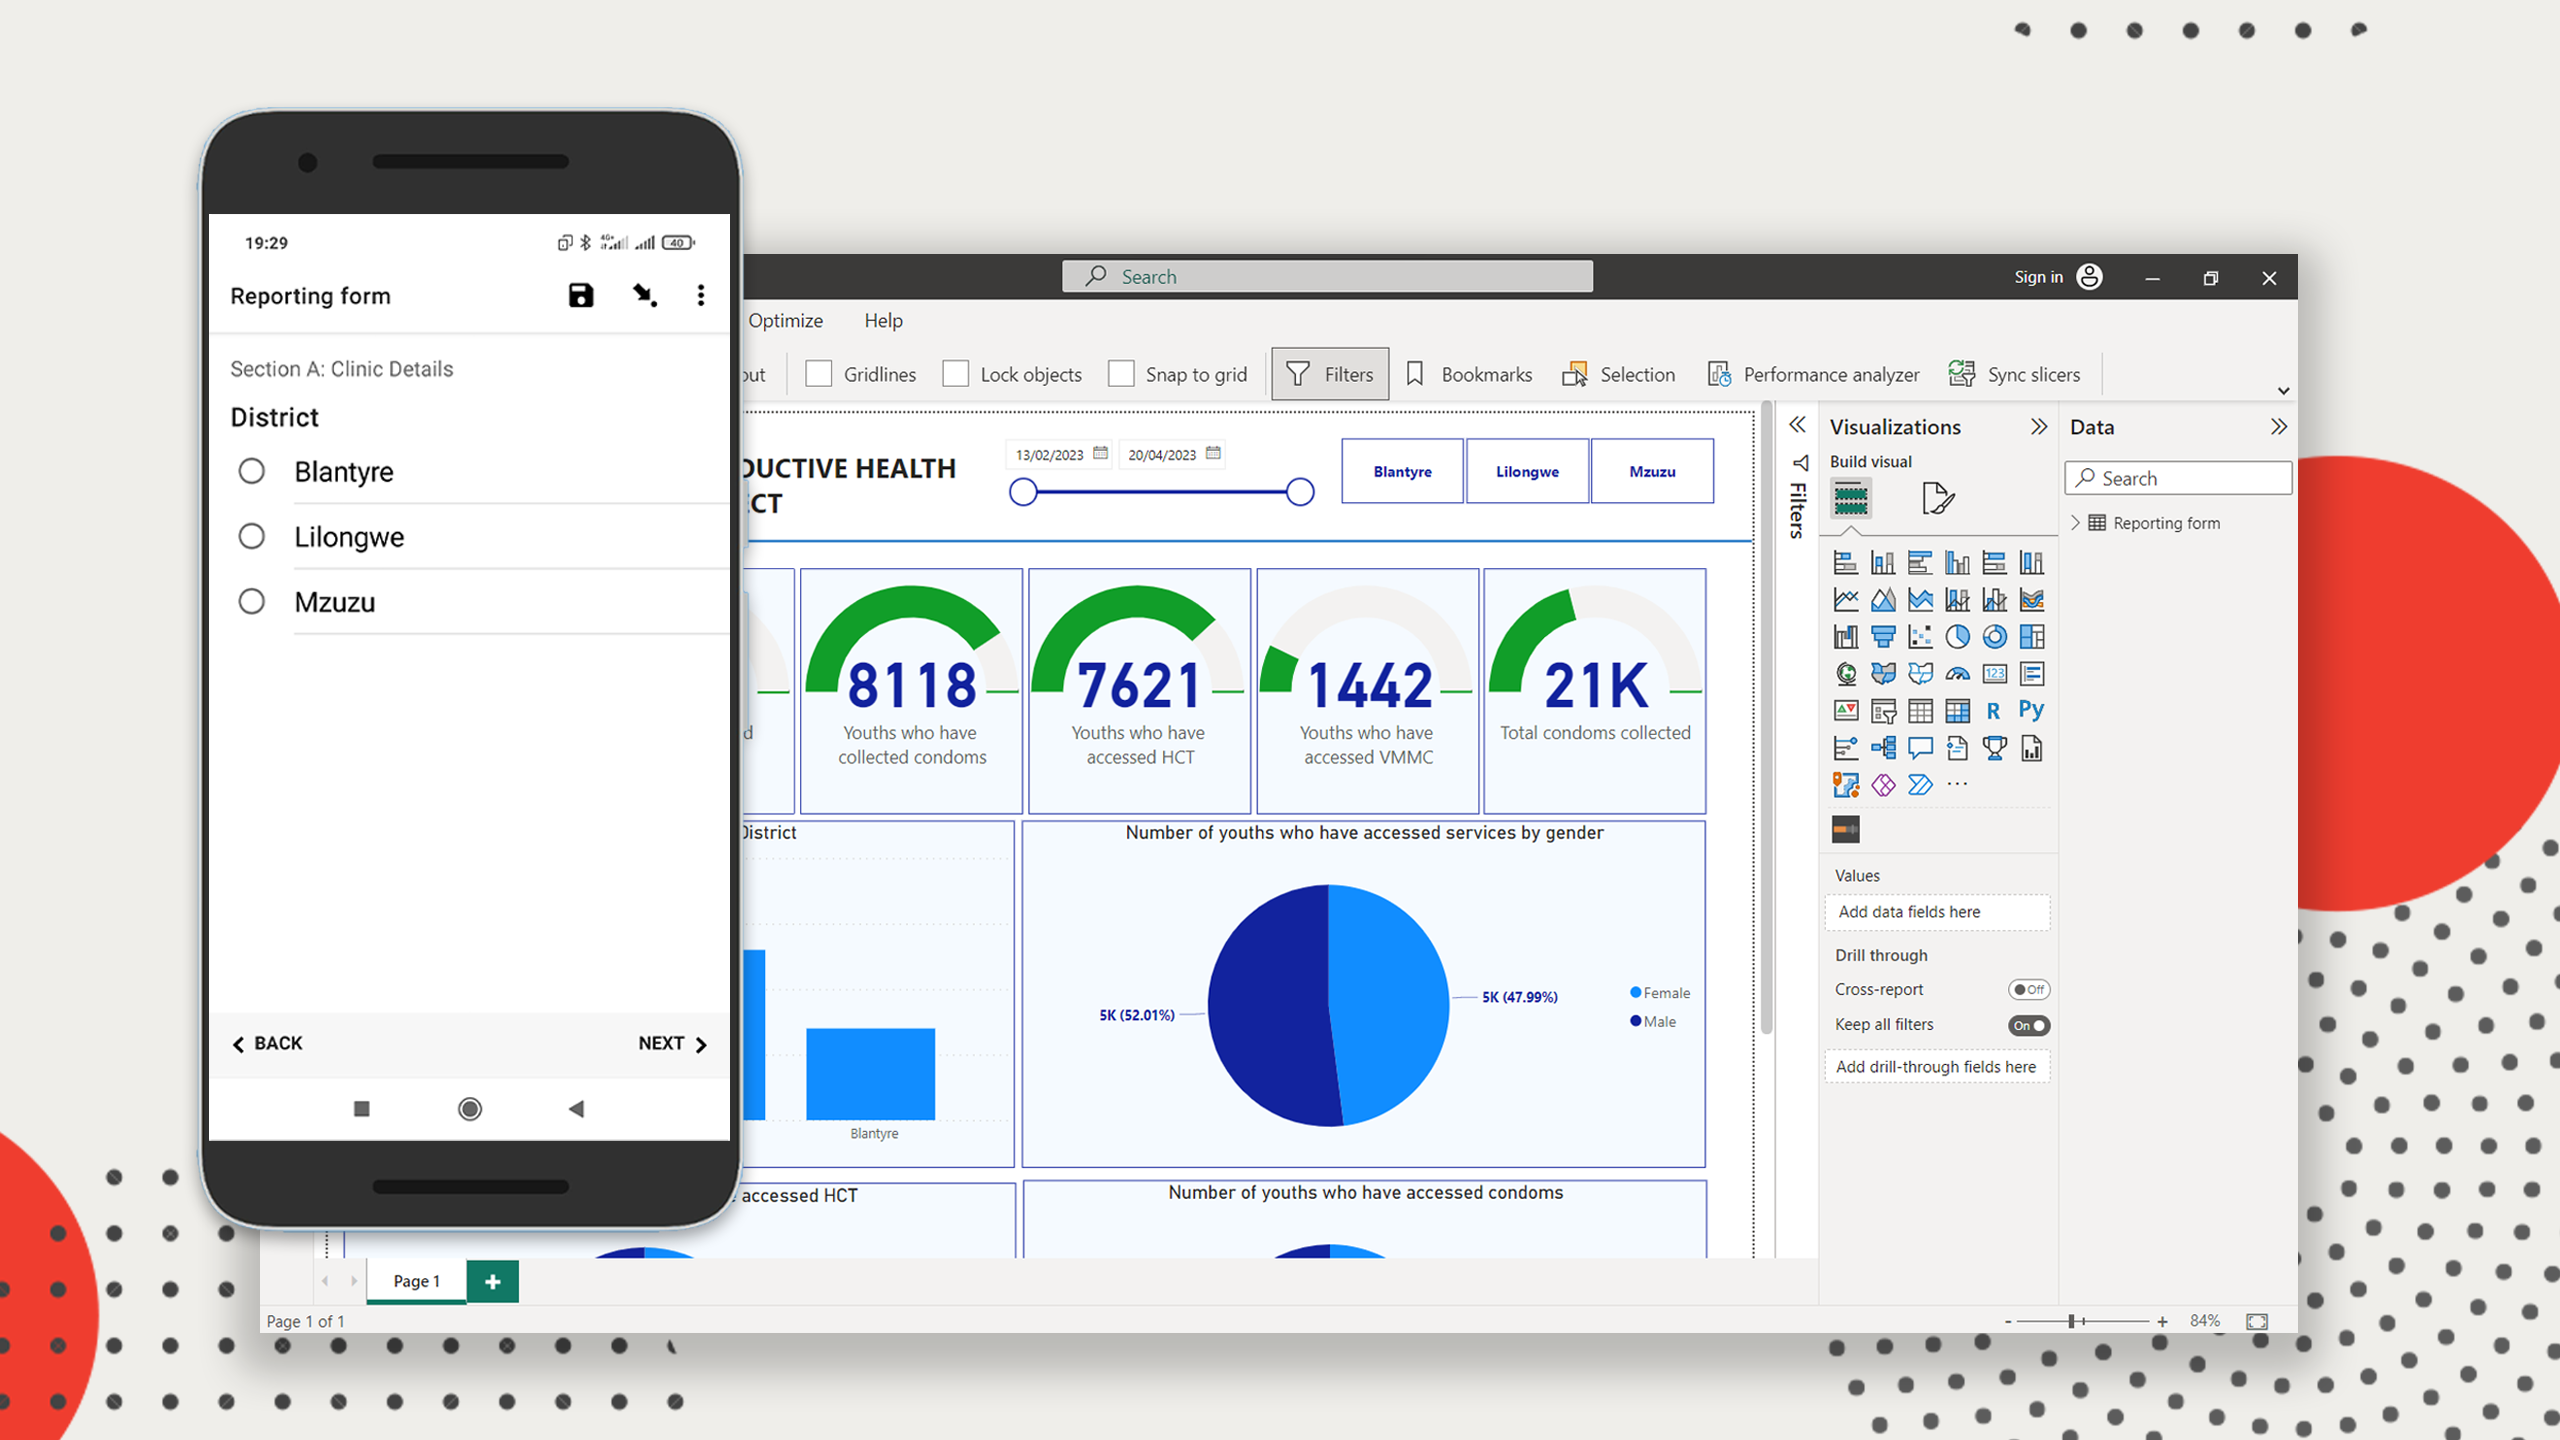
“Developing Real-Time Monitoring & Evaluation Dashboards using KoboToolbox & Power BI” is a comprehensive course designed to revolutionize the way you track and communicate your project’s progress!
Are you tired of outdated, static reports and tedious manual processes?
Do you want to make data-driven decisions and effectively communicate your project’s progress to stakeholders?
Do you want to learn how to develop a digital solution for monitoring and evaluating your project?
Look no further! This course equips you with the skills and knowledge you need to develop interactive, real-time monitoring and evaluation (M&E) dashboards, streamlining the way you manage projects and enhancing stakeholder engagement.
What you’ll learn
- Developing a mobile data collection form in KoboToolbox
- Deploying your form on mobile devices, collecting data and uploading data to the KoboToolbox server
- Connecting your KoboToolbox project with Power BI using the KoboToolbox Synchronous API
- Exploring and cleaning the data in Power BI Desktop using the Power Query Editor
- Calculating columns and measures
- Developing a dashboard report in Power BI Desktop using visualizations such as column/bar charts, cards, pie charts, line charts, gauges, slicers and more
- Publishing the dashboard report on the Power BI service platform, setting up scheduled refresh and sharing the report
Course content
Introduction
- Course intro
- Course orientation
Step 1: Review your M and E framework and data collection tools
- The case study
- A walk-through of the M and E framework
- A walk-through of the reporting form
Step 2: Create the data collection form in KoboToolbox
- Create the form in KoboToolbox
- Deploy the form to mobile devices, collect data and upload it
- Exploring the data in the KoboToolbox platoform
Step 3: Connect, transform, and model data
- Getting the API URL
- Importing KoboToolbox data to Power BI
- Exploring and cleaning the data
- Creating calculated columns
- Creating measures
Step 4: Build and share the dashboard
- Adding visuals
- Customizing the visuals
- Comparisons using column charts and pie charts
- Visualizing trends using the line chart
- Adding filters
- Visualizing progress towards targets
- Putting the dashboard together
- Refreshing the dashboard
Instructor

Alexander Mtembenuzeni
DATAFORDEV Founder
Frequently asked questions
Does this course offer a certificate?
How long will it take for me to complete the course?
Which days and times does the course run?
This course is self paced. Once you enroll, you can go through the learning content at any time, and at your own pace!
Instant access
Approximately 7 days to complete
Level
OR
