About this course
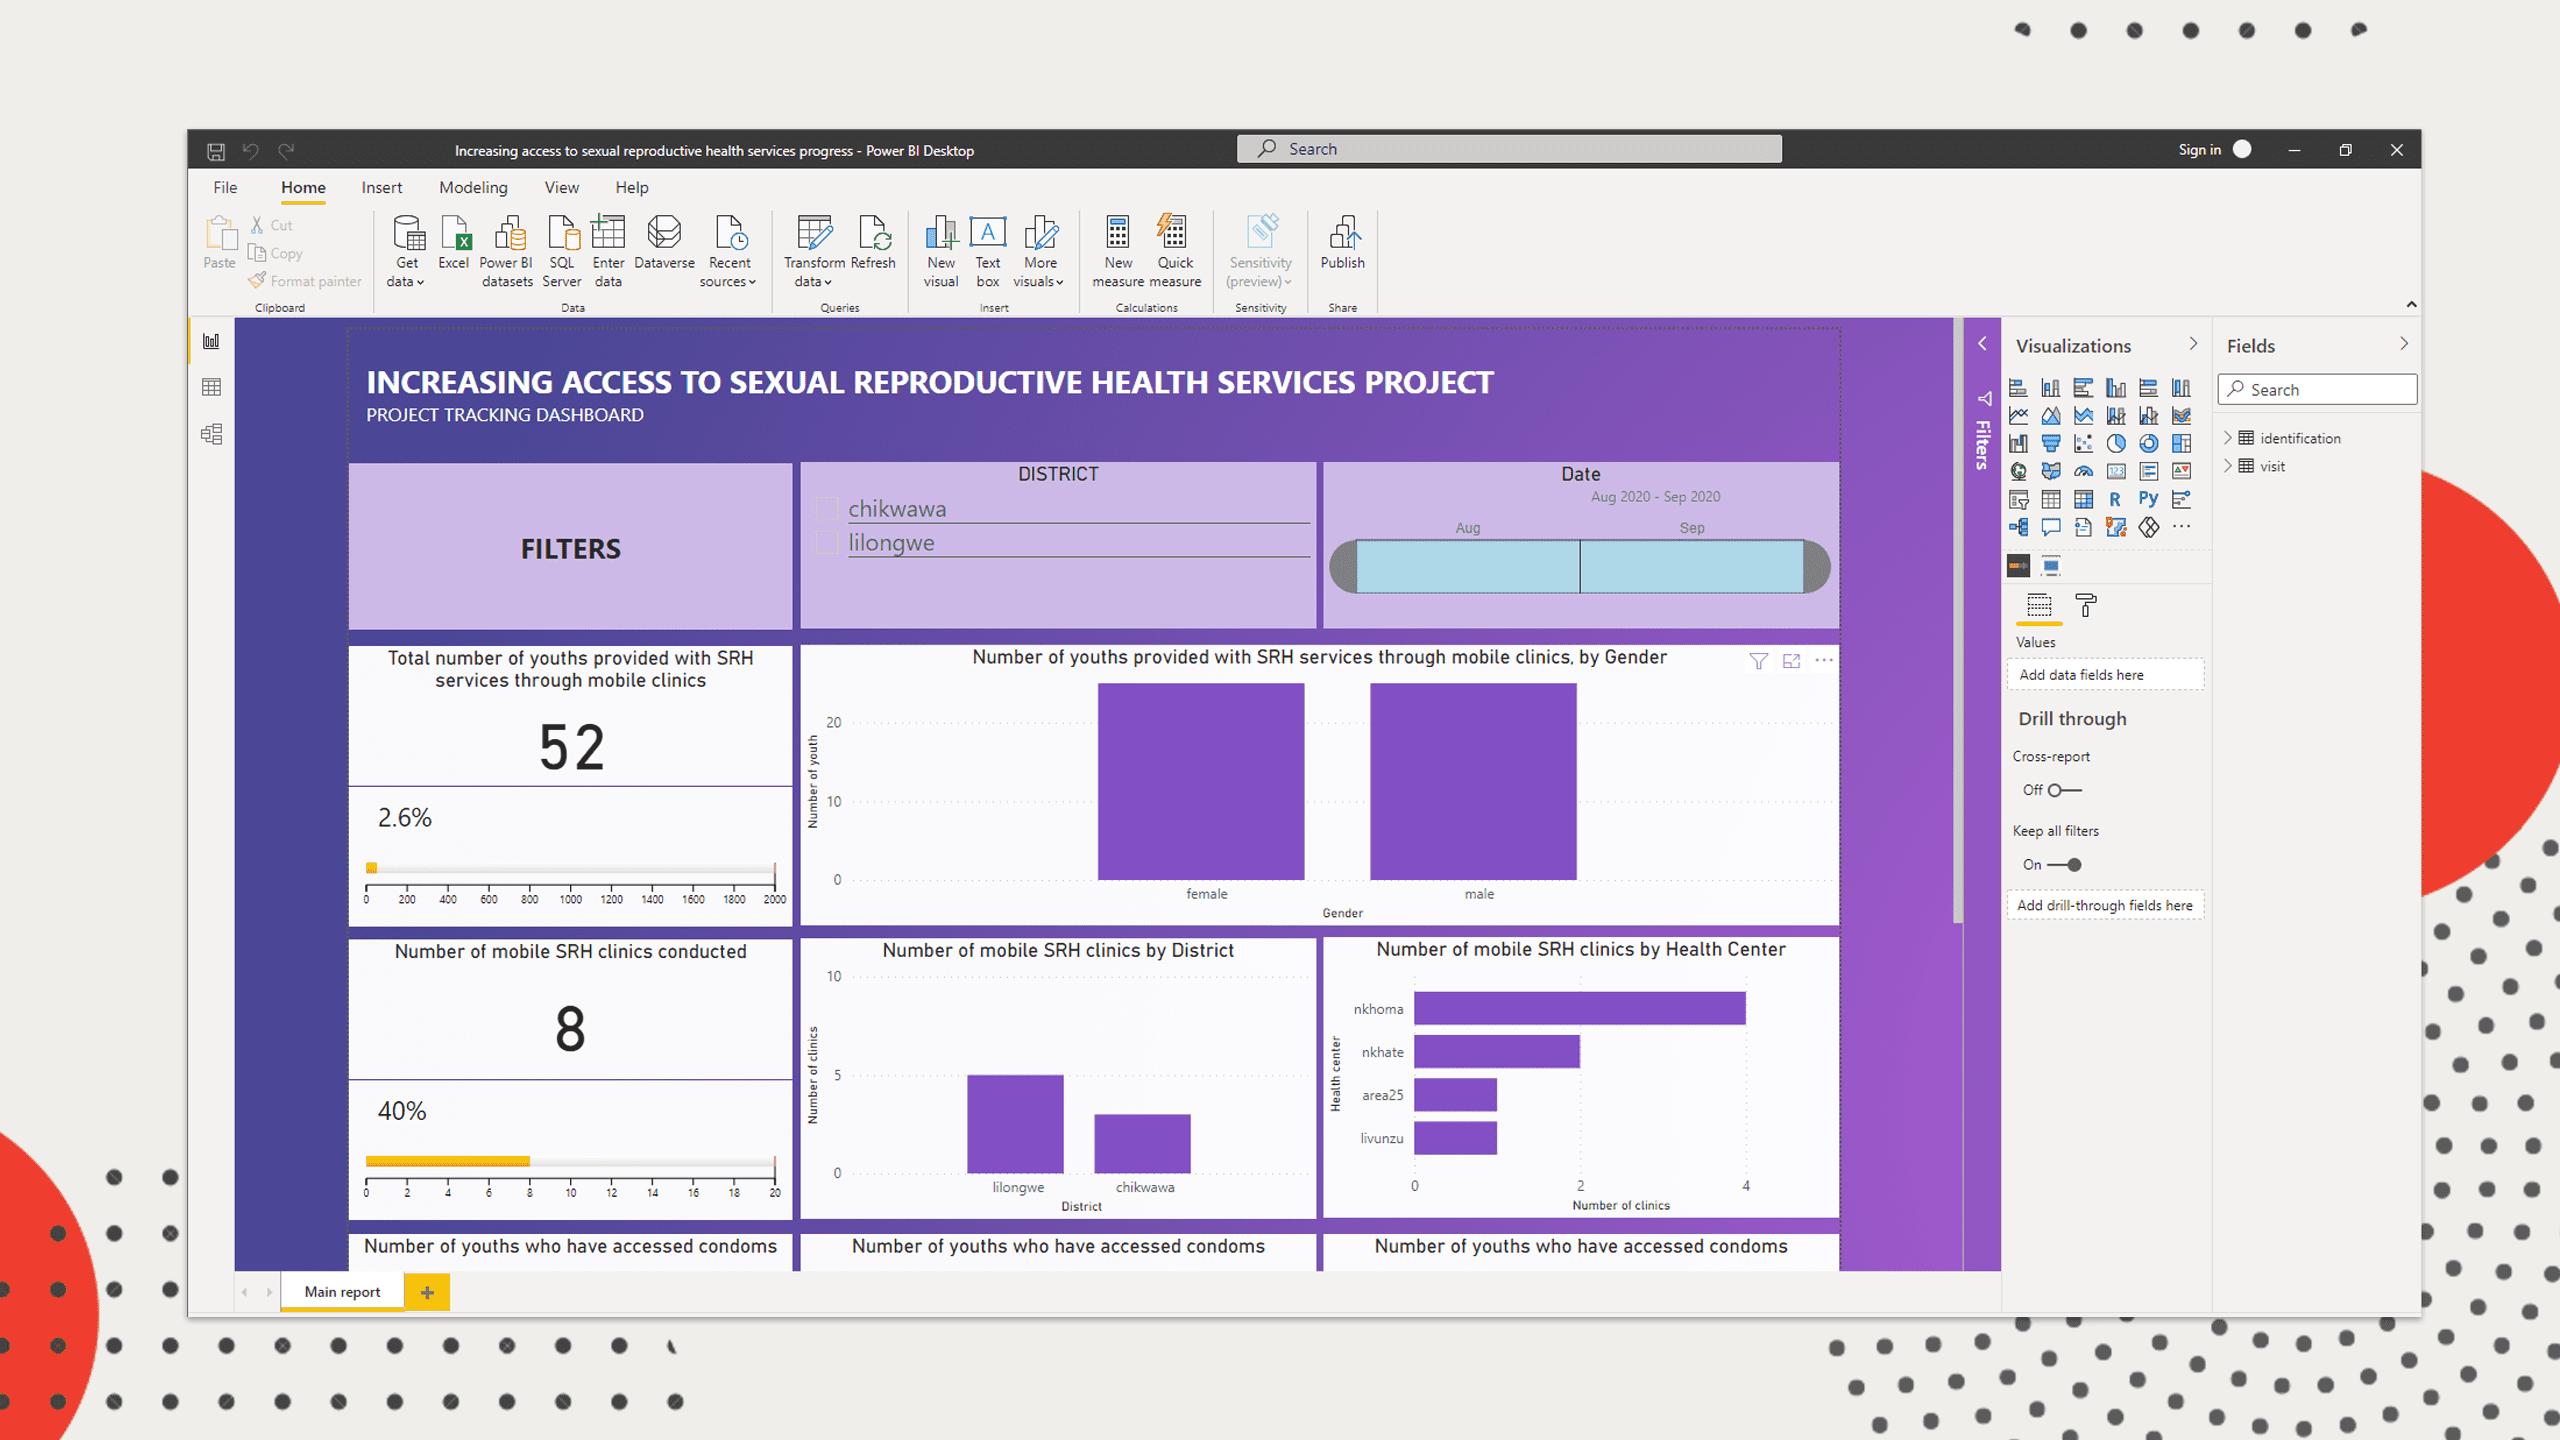
Microsoft Power BI is one of the best data analysis and visualization software available. With it, you can develop dynamic reports and dashboards, integrating data from multiple sources such as Excel files, databases and online platforms like KoBo Toolbox.
In this course, you will learn move from beginner to pro Power BI user using case studies in social/humanitarian programming
What you’ll learn
- Connecting to different data sources
- Transforming data and editing queries
- Creating visuals
- Creating calculated columns and measures using DAX
- Putting visuals together to form dashboards
- Publishing and sharing dashboards
Course content
Introduction
- What is data analytics
- Types of data analytics
- What is data visualization
- Place of data visualization in social development projects
- Elements of data visualizations
- Examples of data visualizations
- Module summary
Getting started with Microsoft Power BI
- What is Power BI
- The Power BI interface
- Power BI building blocks
- Overview of building reports and dashboards in Power BI
- Connecting to a Microsoft Excel workbook
- Creating your first visualizations
- Editing and formatting visuals
- Using the report
- Module summary
- Module practice project
Connecting to data
- Connecting to Microsoft Access files
- Connecting to KoBo Toolbox
- Connecting to other KoBo servers
- Connecting to Google Sheets
- Module summary
Cleaning, transforming and loading data
- Promoting rows
- How data transformations work
- Deleting rows and columns
- Replacing values
- Editing field names and types
- Resolving data importing errors using M code
- Module summary
Modelling data
- Introduction to data modelling
- Getting ed with table relationships
- Configuring column and table properties
- Creating and using hierarchies
- Defining row level security
- Module summary
Performing calculations using DAX
- Introduction to DAX
- Creating Quick Measures
- Creating measures
- Creating calculated columns
- Using the CALCULATE function
- Using CALCULATE with multiple conditions
- Filter modifier functions in CALCULATE
- Time intelligence YTD
Creating visuals and reports
- Introduction
- Bar and column charts
- Line and area charts
- Line and bar combo chart
- Ribbon charts
- Waterfall charts
- Funnel chart
- Scatter plot
- Pie and donut chart
- Treemap
- Maps
- Gauge
- Cards
- KPI
- Table and matrix
- Custom visuals
- Configuring and customizing visuals
- Customizing pages
- Slicing and filtering
- Conditional formatting
Project
Project: Developing a digital M and E system using KoboToolbox and Microsoft Power BI
Publishing and sharing
Publishing and sharing
Instructor

Alexander Mtembenuzeni
Data Analyst, Instructor
DATAFORDEV Founder
Alexander has over 8 years experience training social impact organizations in data analytics. He also has consulted for small and big organizations alike – developing data collection tools, building M and E systems and analyzing data. He is a 4.5/5-rated instructor on Udemy.com where he has several courses with a combined over 6,000 students. He also loves blogging and creating tutorial videos for the Data for Development YouTube channel.
Frequently asked questions
Does this course offer a certificate?
Yes. You will automatically get a certificate of completion as soon as you complete the course and pass the graded quizzes and project
How long will it take for me to complete the course?
We recommend investing 2 hours of learning per day. With that time investment, you will finish the course including the hands-on practices in 7 days.
Which days and times does the course run?
This course is self paced. Once you enroll, you can go through the learning content at any time, and at your own pace!
Instant access
Start as soon as you enroll
Approximately 14 days to complete
Suggested 2 hours per day
Level
Beginner to Intermediate
OR
