About this course
The Microsoft Excel Intermediate course is targeted for Excel users who would like to upgrade their understanding of performing calculations and data analyses using Microsoft Excel.
The course will introduce you to advanced functions such as conditional mathematics, date and time functions, logical functions, text functions, and lookup functions.
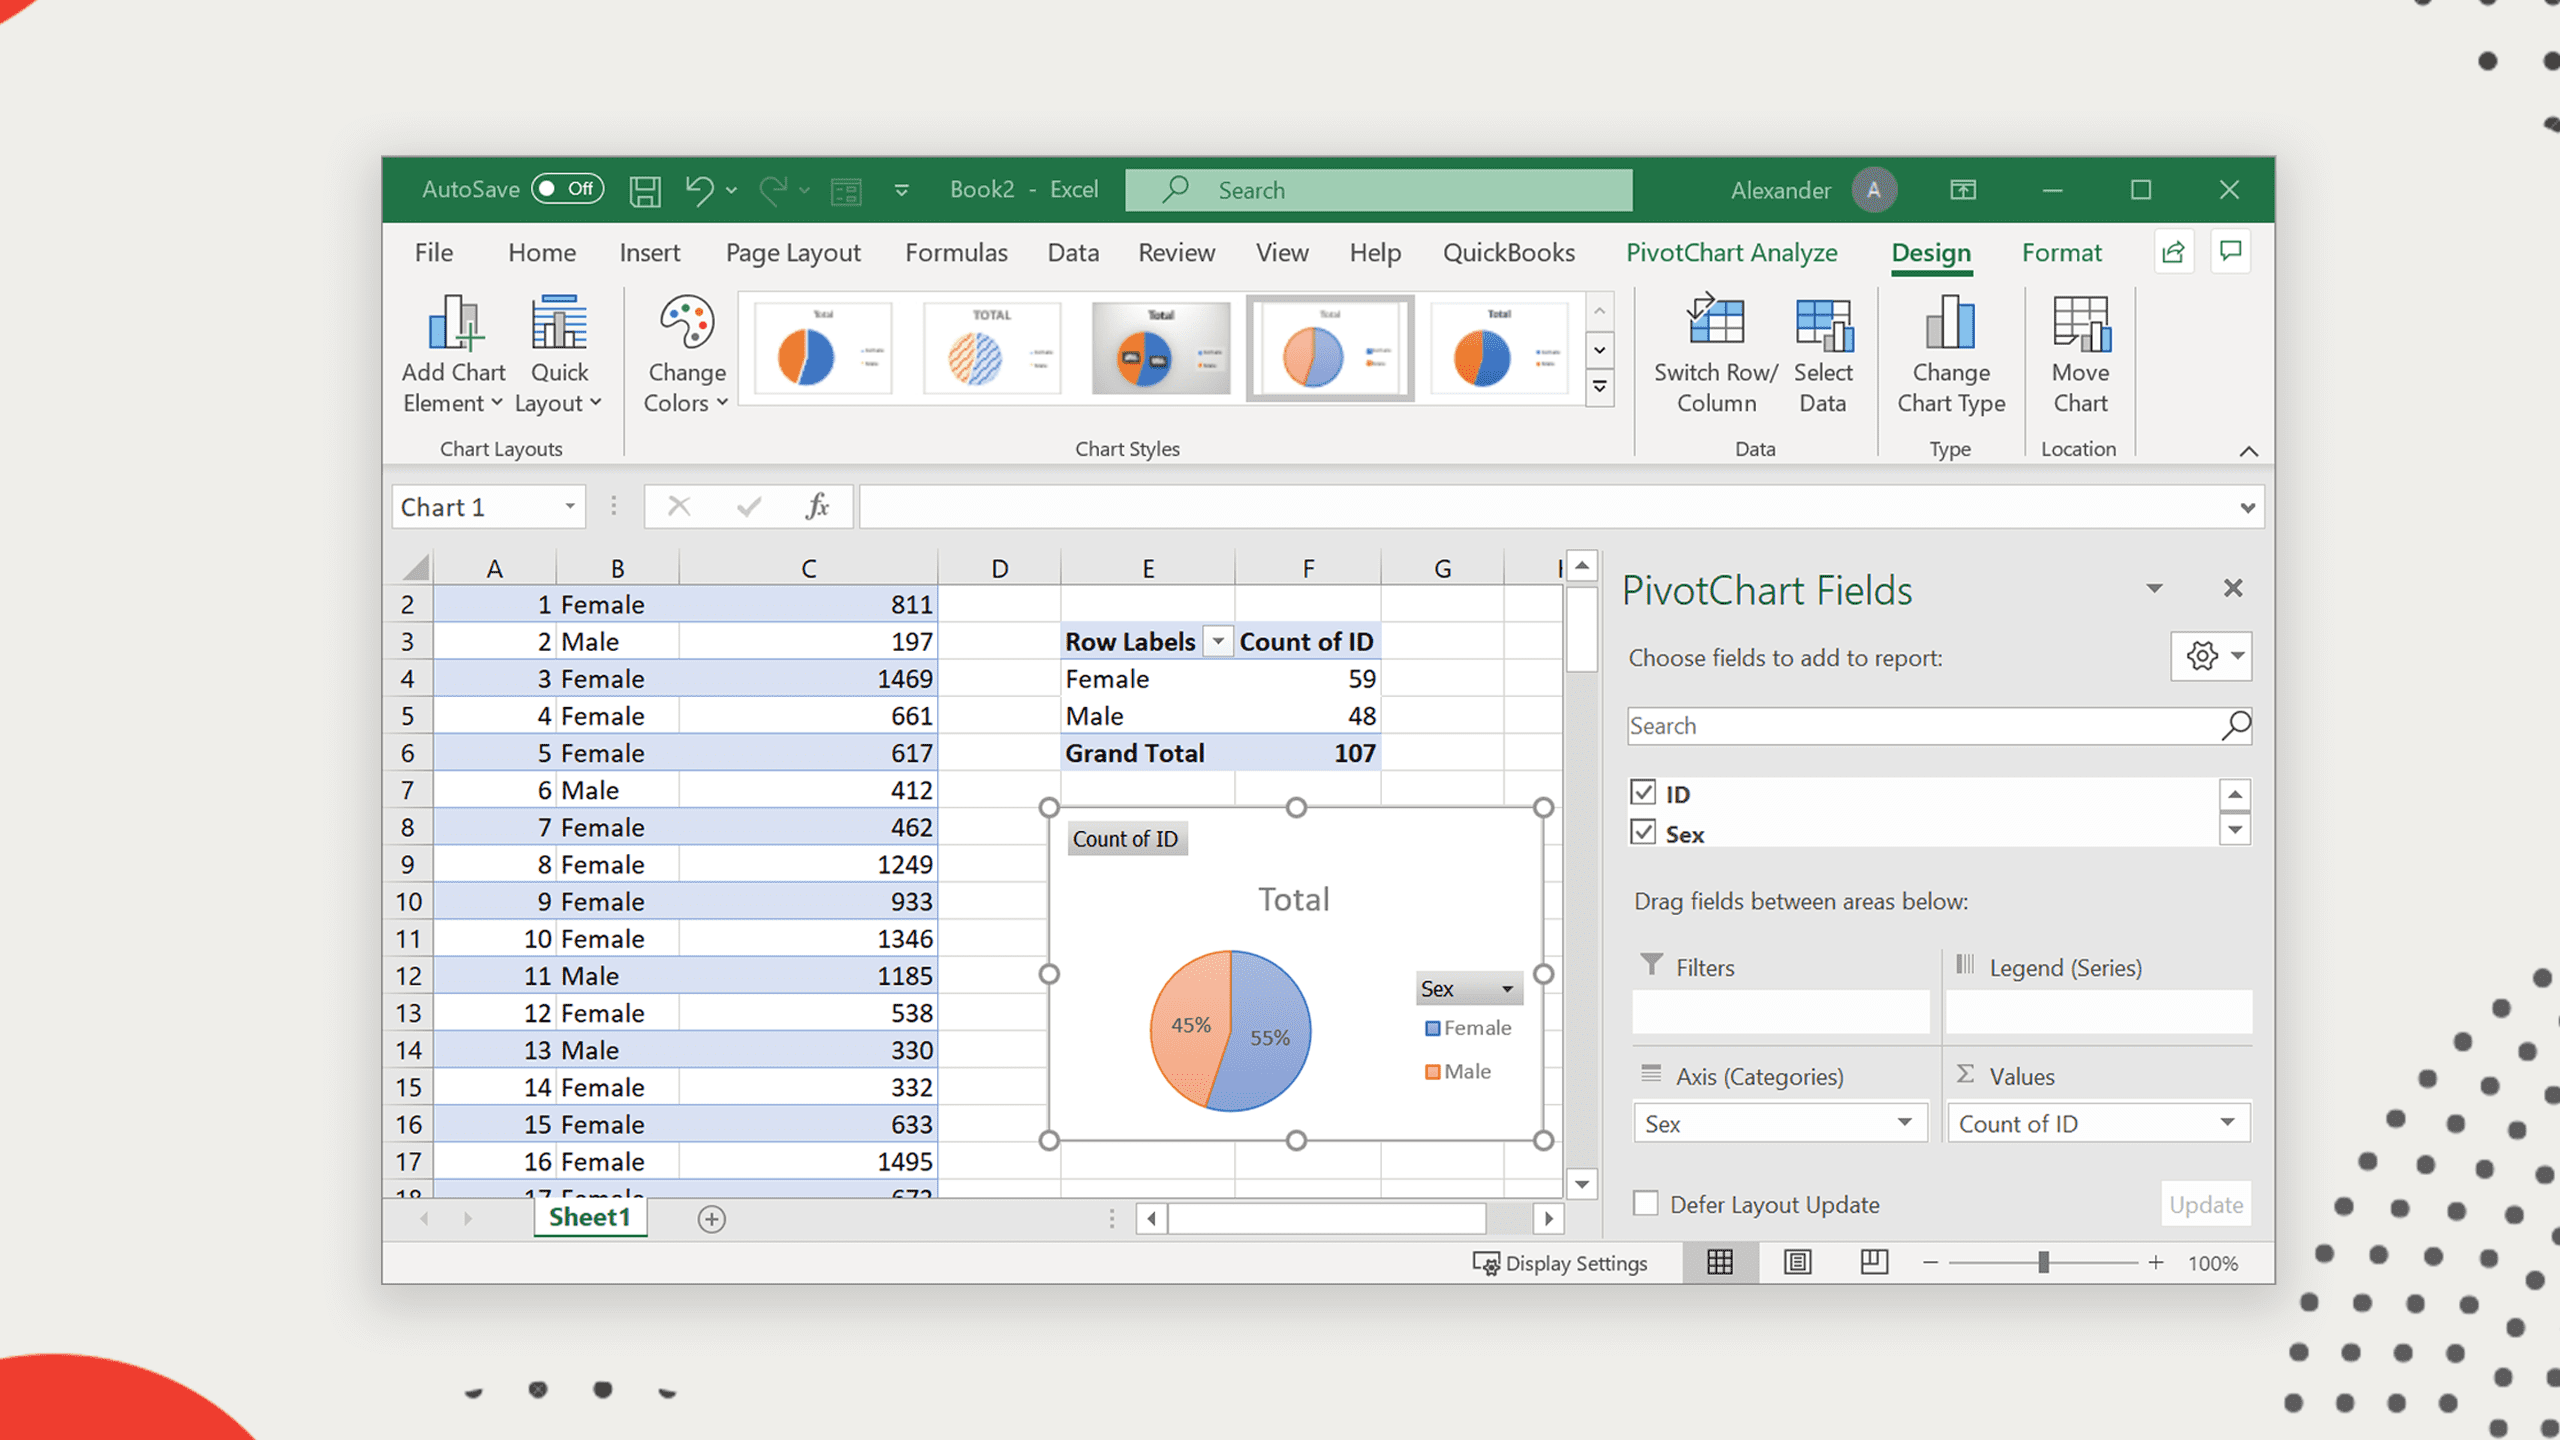
You will also get started with data analysis using pivot tables and pivot charts.
What you’ll learn
- Advanced methods of getting data into Microsoft Excel such as data entry forms, autofill, flash fill and more
- Managing data in Microsoft Excel
- Creating and working with tables
- Applying conditional formatting
- Conditional mathematical functions such as SUMIF, AVERAGEIF and more
- Logical functions
- Date and time functions
- Text functions
- Lookup functions
- Creating and customizing charts
- Analyzing data using pivot tables and pivot charts
Course content
Getting data into Excel
- Data Validation Basics
- Data validation for text data
- Using formulas in validation criteria
- Autofill introduction
- Flash fill
Cell referencing
- Absolute referencing
- Named cells
- Named ranges
Working with tables
- Creating tables
- Modifying tables
- Sorting data in tables
- Filtering data in tables
- Structured referencing
Conditional formatting
- Introduction to conditional formatting
- Using built-in conditional formatting
- Custom conditional formatting
- Conditional formatting using formulas
Conditional calculations
- SUMIF
- AVERAGEIF
- Numeric criteria
- Date criteria
- COUNTIF
- SUMIFS
- AVERAGEIFS
- COUNTIFS
- MAXIFS and MINIFS
Logical functions
- IF
- IF, AND
- IF, OR
- Nested IF
- IFS
Date functions
- Basics of dealing with dates in Excel
- NOW and TODAY
- EDATE and EOMONTH
- DAYS
- DATEDIF
- NETWORKDAYS
Text functions
- CONCATENATE
- TRIM
- LEFT
- MID
- RIGHT
Lookup functions
- VLOOKUP
- HLOOKUP
- INDEX and MATCH
- XLOOKUP
Charts
- Criteria for choosing a type of chart
- Creating bar and column charts
- Introduction to chart customization
- Customizing bar and column charts
- Creating and customizing line charts
- Creating and customizing pie charts
- Creating and customizing combo charts
- Creating and customizing sparklines
Pivot tables and pivot charts
- Introduction to pivot tables
- Using automatic pivot tables
- Creating a pivot table from scratch
- Creating calculated fields in the pivot table
- Sorting and filtering pivot tables
- Customizing pivot table
Instructor

Alexander Mtembenuzeni
Data Analyst, Instructor
DATAFORDEV Founder
Alexander has over 8 years experience training social impact organizations in data analytics. He also has consulted for small and big organizations alike – developing data collection tools, building M and E systems and analyzing data. He is a 4.5/5-rated instructor on Udemy.com where he has several courses with a combined over 6,000 students. He also loves blogging and creating tutorial videos for the Data for Development YouTube channel.
Frequently asked questions
Does this course offer a certificate?
Yes. You will automatically get a certificate of completion as soon as you complete the course and pass the graded quizzes and project
How long will it take for me to complete the course?
We recommend investing 2 hours of learning per day. With that time investment, you will finish the course including the hands-on practices in 7 days.
Which days and times does the course run?
This course is self paced. Once you enroll, you can go through the learning content at any time, and at your own pace!
Instant access
Start as soon as you enroll
Approximately 21 days to complete
Suggested 2 hours per day
Level
Intermediate
OR
